
The index has been capped by the resistance zone of 94.85 and it would be likely to see a decline towards the support zone of 94.16. The 200 SMA at H1 chart still points to the downside and the preferred scenario remains in favor of the bears. Next targets should be the 94.16 and 93.29 levels. MACD indicator is turning neutral, favoring for sideways' moves in USDX.
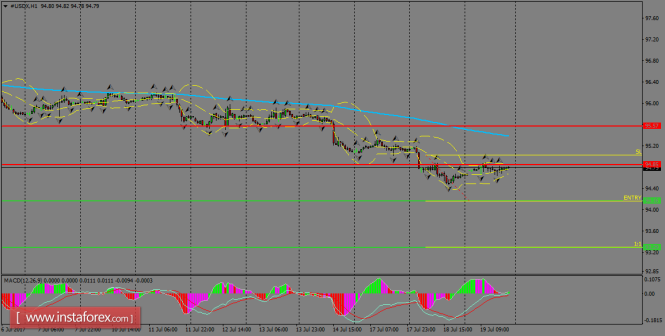
H1 chart's resistance levels: 94.85 / 95.57
H1 chart's support levels: 94.16 / 93.29
Trading recommendations for today: Based on the H1 chart, place sell (short) orders only if the USD Index breaks with a bearish candlestick; the support level is at 94.16, take profit is at 93.29 and stop loss is at 95.02.
The material has been provided by InstaForex Company - www.instaforex.com