
The pair has been in a consolidation tone since Wednesday's session and looks for a catalyst that triggers longs. We're expecting such scenario due to the current position of the 200 SMA at H1 chart and if that happens, then we would like to see an advance towards 1.3106. If it manages to break above it, the next target should be the 1.3238 zone.
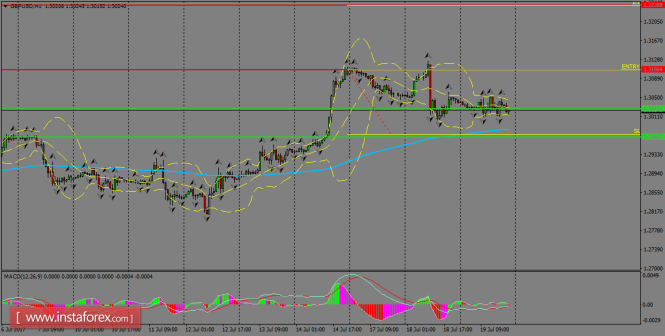
H1 chart's resistance levels: 1.3106 / 1.3238
H1 chart's support levels: 1.3026 / 1.2968
Trading recommendations for today: Based on the H1 chart, buy (long) orders only if the GBP/USD pair breaks a bullish candlestick; the resistance level is at 1.3106, take profit is at 1.3238 and stop loss is at 1.2971.
The material has been provided by InstaForex Company - www.instaforex.com