MG Network

something big isHappening!

In the mean time you can connect with us with via:

Copyright © Money Grows Network | Theme By Gooyaabi Templates

Money Grows Network

Archive

Powered by Blogger.

Welcome To Money Grows Network

Verified By

2006 - 2019 © www.moneygrows.net

Investments in financial products are subject to market risk. Some financial products, such as currency exchange, are highly speculative and any investment should only be done with risk capital. Prices rise and fall and past performance is no assurance of future performance. This website is an information site only.

Popular

Pages

Expert In

Name*


Message*

Ichimoku indicator analysis of NZD/USD for June 28, 2017

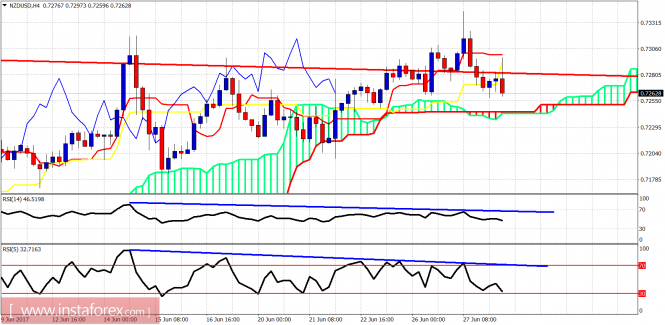
The price action here is very bearish. Technically we have a fake breakout and rejection. Bearish divergence signs. Reversal candle formations.

analytics59536124cf157.png

In the 4-hour chart, the price has broken below both the tenkan- and kijun-sen indicators and is going to test the Ichimoku cloud support. Both RSI indicators have provided bearish divergence signals. Support is at 0.7240.

analytics59536167b815b.png

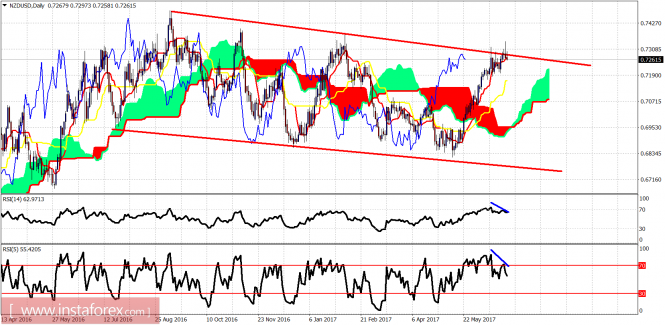
Red lines - bearish channel

The NZDUSD has made a false break out above the upper channel boundary and is turning downwards. I expect a deep pull back for this pair at least towards 0.7165 as the price is already trading below the tenkan-sen.

The material has been provided by InstaForex Company - www.instaforex.com