
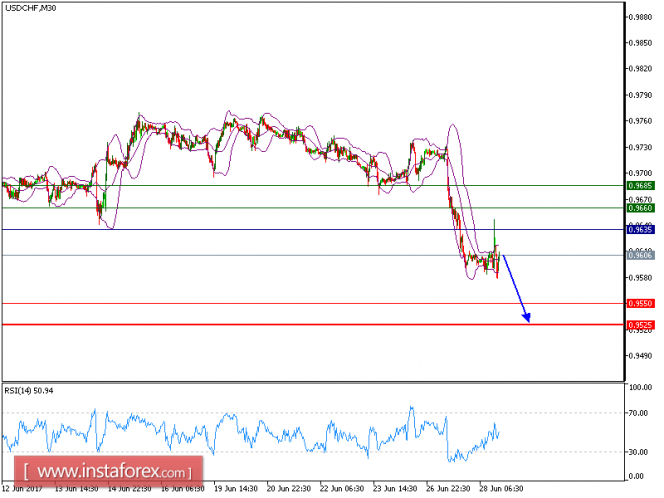
All our targets in the USD/CHF pair, which we predicted on 26th June, have been hit. USD/CHF is under pressure; and the downside trend is still expected to prevail. The pair is holding on the downside. Further downward momentum is reinforced by the declining 20-period and 50-period moving averages. The relative strength index has broke down its oversold level of 30, but has not displayed any reversal signal.
Hence, as long as 0.9635 is resistance, another decline to 0.9550 and even to 0.9525 seems more likely to occur.
Chart Explanation: The black line shows the pivot point; the present price above pivot point indicates the bullish position and below pivot points indicates the short position. The red lines show the support levels and the green line indicates the resistance levels. These levels can be used to enter and exit trades.
Strategy: SELL, Stop Loss: 0.9635, Take Profit: 0.9550
Resistance levels: 0.9660, 0.9685, and 0.9705
Support levels: 0.9550, 0.9525, and 0.9500
The material has been provided by InstaForex Company - www.instaforex.com