Trading plan for 16/02/2017:
There will not be many economic releases during the European and American trading sessions. The major fundamental events for today are: Building Permits and Housing Starts, Philly Fed Manufacturing Index, and Unemployment Claims from the US. Later on the Retail Sales data from New Zealand will be released as well.
01:30 pm GMT - Building Permits and Housing Starts, Philly Fed Manufacturing Index and Unemployment Claims from the US
The National Association of Home Builders (NAHB) reported that the home building index decreased for a second time, but the sentiment still remains elevated. Today, the market participants expect a slight increase from 1,210k permits to 1,230k permits. Today's strong data on housing starts is expected to inch higher for January. The market participants expect a rise to 1.227 million units (seasonally adjusted) and this would be a three-month high figure, but the outlook for another month of generally flat activity will be hard to shake if the estimate is accurate.
The Initial Jobless Claims data released at the same time as the housing data are expected to increase as well from 234k to 243k. Nevertheless, the US labour market has been expanding every month for over six years now and there is no sign of this trend to reverse soon.
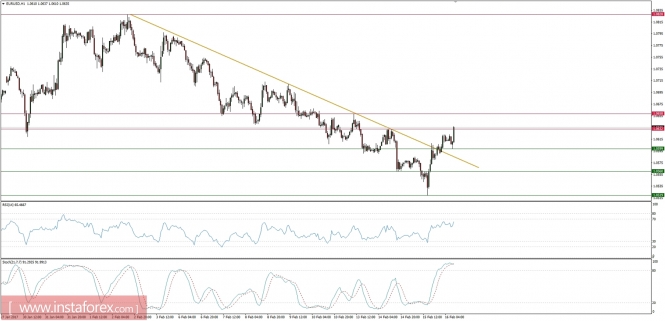
Let's take a look at the EUR/USD technical picture at H1 time frame before the news is released. Better than expected data will generally result in US Dollar appreciation, so the technical resistance should hold at the level of 1.0632 and market should reverse. Overbought market conditions support this view and the higher time frame trend is still bearish.
09:45 pm GMT - Retail Sales from New Zealand
Retail Sales are the primary gauge of consumer spending, which accounts for the majority of overall economic activity. For the last quarter of 2016 the global investors are expecting a slight increase on sales from 0.9% last quarter to 1.1% this quarter. The uptick in the retail sales might suggest a positive consumer sentiment and the overall positive outlook for the economy.
Let's take a look at the NZD/USD technical picture at the H1 time frame. The recent market rally was capped at the technical resistance at the level of 0.7242 and now is trading sideways. In a case of retail sales data will beat the expectations there is a chance of a further spike up towards the next technical resistance at the level of 0.7278. Nevertheless, the worse than expected data, the price should fall out of the horizontal range and move towards the next support at the level of 0.7197.

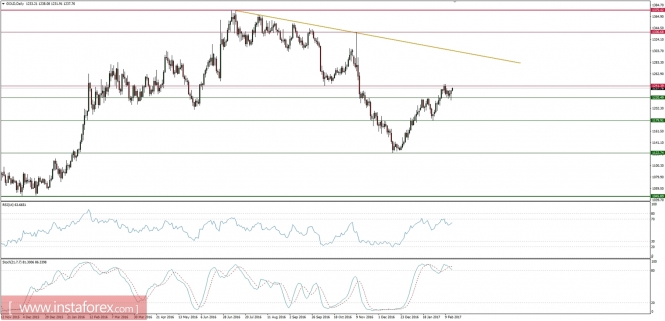
Market snapshot - Gold is bouncing from technical support
The yellow metal rally was capped at the level of $1,241 and since then the price has been trading sideways. The technical support at the level of $1,220 was tested and the price bounced back up. Nevertheless, the current market conditions are overbought at the daily time frame and there is a clear bearish divergence suggested by the momentum indicator. This is why all buy orders should be very careful at this point of time as some bigger correction might be just around the corner.