
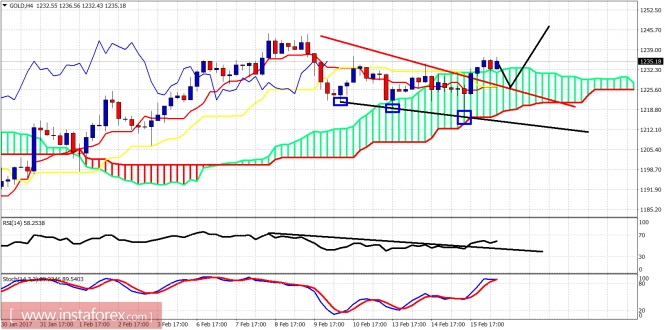
Gold made a very bullish reversal yesterday. Despite falling towards $1,216, support was briefly broken but buyers stepped back in despite Dollar strength and supported the price. Moreover, the price continued higher and closed above $1,228-33 area where it is trading now.
Black line - support
Gold has broken again above the 4-hour Kumo (cloud) resistance. The price has also broken out of the descending triangle pattern. It made a big reversal at noon when it was trading around $1,216. Gold is very resilient and all pullbacks are bought and heavily supported. We might see a back test of the broken red trendline but overall I expect Gold to push towards $1,280-$1,320 soon.
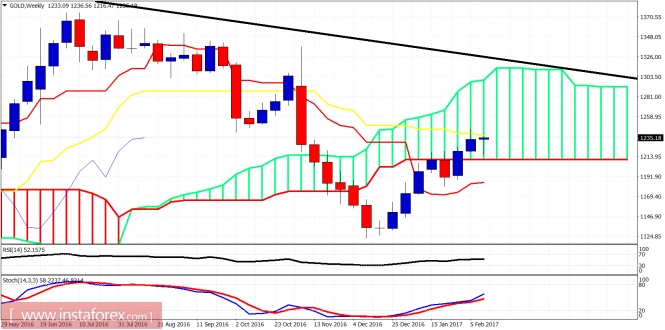
The weekly candle is shaping up to be a very bullish one as we can see a long lower tail shadow suggesting that the price is heavily supported and pushed higher despite selling pressures. The price is holding inside the weekly Kumo (cloud) and is testing the weekly kijun-sen (yellow line indicator). I expect gold breaks above it and will move towards the upper cloud boundary and the long-term trendline resistance.
The material has been provided by InstaForex Company - www.instaforex.com