
The index is still alive in a bullish bias above the 200 SMA at H1 chart, but the resistance zone of 101.43 continues to cap further gains. However, the fact that USDX still trades above that moving average is giving us an idea about what's the coming path for the index, at least in the short-term. If that barrier to the upside gives up, then a rally to test the 102.39 is expected to happen.
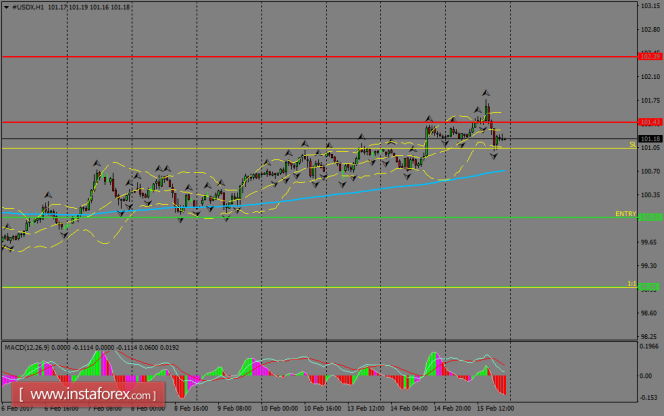
H1 chart's resistance levels: 101.43 / 102.38
H1 chart's support levels: 100.01 / 98.98
Trading recommendations for today: Based on the H1 chart, place sell (short) orders only if the USD Index breaks with a bearish candlestick; the support level is at 100.01, take profit is at 98.98 and stop loss is at 101.03.
The material has been provided by InstaForex Company - www.instaforex.com