
On the last day of weekly trading, I suggest you turn your attention to the technical picture that is observed for the AUD/USD currency pair. This pair is quite interesting and loved by many, so do not forget about it. For the completeness of the description of the technical picture of the "Aussie", despite Friday, I suggest starting with a review of the weekly timeframe.
Weekly
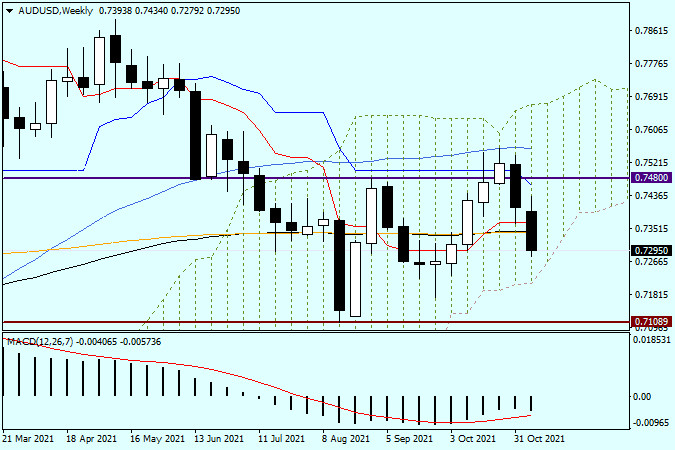
So, at last week's auction, the pair showed a downward trend, but the decline was stopped by the red Tenkan line of the Ichimoku indicator, as well as the black-89 and orange-200 exponential moving averages that merged. However, the trading of the current five-day period showed that it was just a technical rebound from the indicated indicators. At the auction on November 8-12, the decline continued, and now the Aussie is trading near the strong technical level of 0.7300. In addition, one should not discount the fact that the pair continues to be within the Ichimoku indicator cloud, which in itself is a zone of uncertainty. Since the weekly trading ends today, I do not see the point in a lengthy and meticulous description of the technical picture. Therefore, I will be brief. To finally indicate their superiority over their opponents, bears on the Australian dollar need to withdraw the quote down from the Ichimoku cloud, after which they break through support at the extremely important and significant level of 0.7100, with mandatory consolidation under this mark.
In this scenario, the road will open to the most important historical, psychological and technical level of 0.7000. I assume that this is where the prospects of the AUD/USD price movement will be determined. In my opinion, the bulls have much more difficult tasks for this tool. They need to return the rate above 89 and 200 exponential, and then go up the blue Kijun line (0.7461), as well as the 50-simple moving average, which is located at 0.7557. Only when these conditions are met will there be real hope for an upward exit from the weekly Ichimoku indicator cloud. Do not forget about the iconic psychological and technical level of 0.7500, which will also be extremely difficult to overcome. In general, players have a lot of difficult work to improve the course. If we summarize the weekly chart, then the bearish prospects of the "Aussie" look more realistic, but only after the above conditions are met and successive fixations under 0.7100 and 0.7000.
Daily
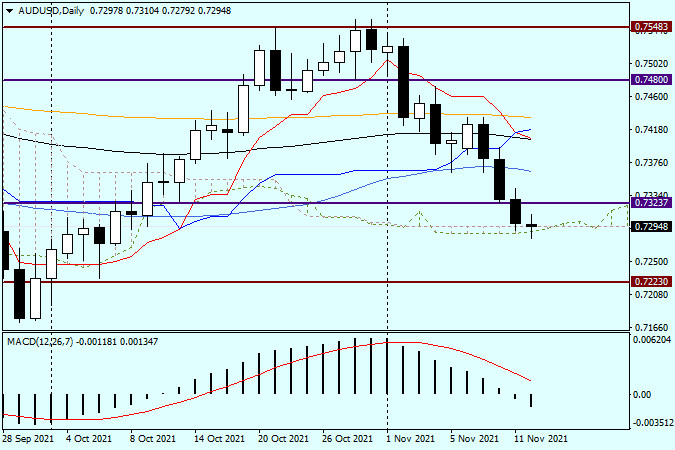
On the daily chart, we see that the pair rested on both borders of the Ichimoku cloud, which at the time of completion of the review do not let the quote lower. If today's trading closes confidently under the boundaries of the daily cloud, the bearish sentiment for the pair will undoubtedly strengthen. If a bullish reversal candle or one of the varieties of Doji candles appears today, we should expect a corrective pullback to the 0.7320-0.7360 area, where after the appearance of bearish candlestick analysis patterns, we should prepare for the pair's sales. If it is even shorter and more clear, then I see the main trading idea for AUD/USD as selling the pair after corrective pullbacks.
The material has been provided by InstaForex Company - www.instaforex.com