
After a productive two weeks, during which Ethereum hit its all-time high several times, the coin suspended its upward movement. As of November 12, Ethereum is trading in a narrow range with a constant bias towards the lower border of the channel.
At the same time, there is a certain decline in the network activity, and the decision to introduce ether into the Discord messenger was negatively perceived by users and was canceled. Taking this into account, the likelihood of a correction in the main altcoin market increases significantly.
In addition to the fundamental factors that provoked a significant collapse of most classic markets and the cryptocurrency market, the decline in activity in the main network indicates the correction of ETH.
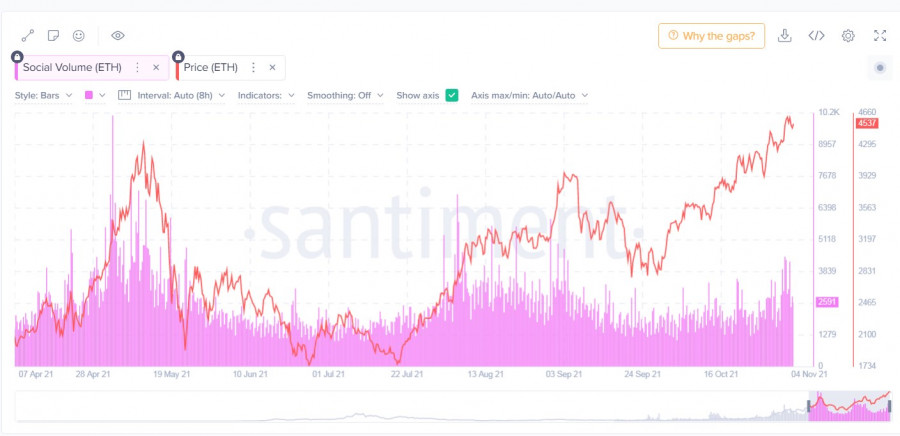
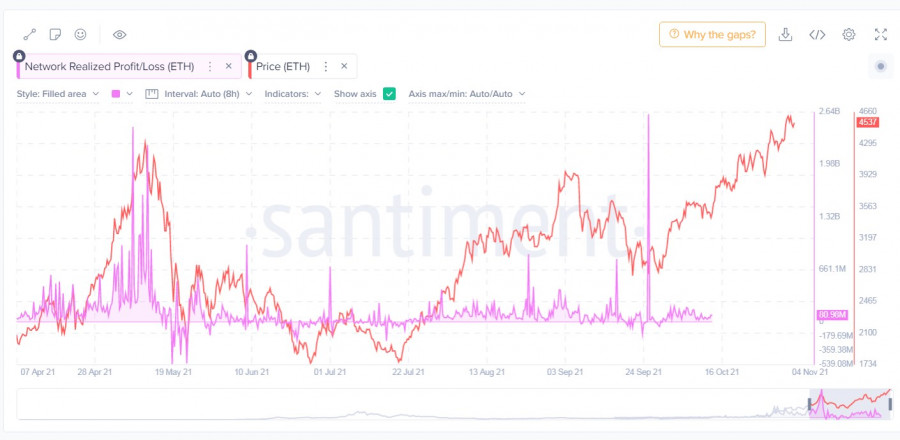
Over the past two weeks, ether quotes have updated the historical maximum several times, and this process has always been accompanied by an increase in on-chain indicators and trading volumes. Now the situation is changing, and the divergence hidden behind the impulsive activation of traders has begun to manifest itself in all major metrics.
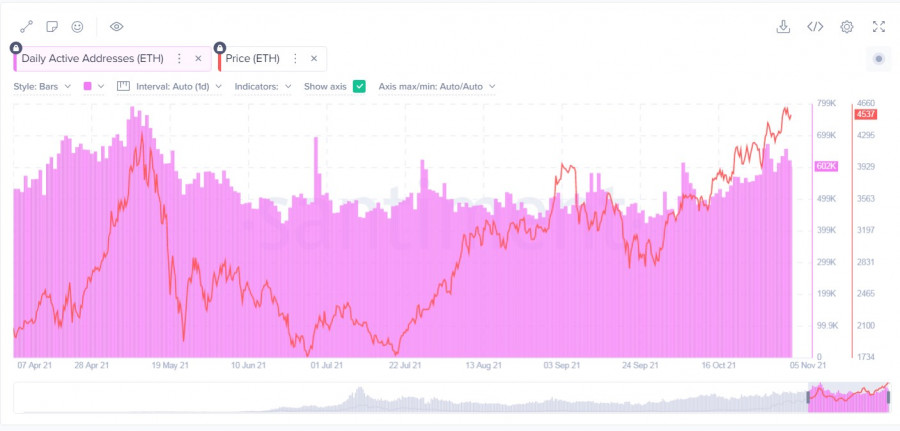
The number of active addresses in the asset's network stopped the upward movement, despite the continuation of the price rally. The indicator stopped at 600,000 and has not been able to overcome it for more than two weeks.
At the same time, impulsive jumps in the growth of the number of addresses are noticeable shortly before the establishment of new historical highs, which locally contributed to hiding the growing divergence. Similar dynamics can be traced in the trading volumes, which are trying to rise above the level of the first maximum, but fail and begin to decline.
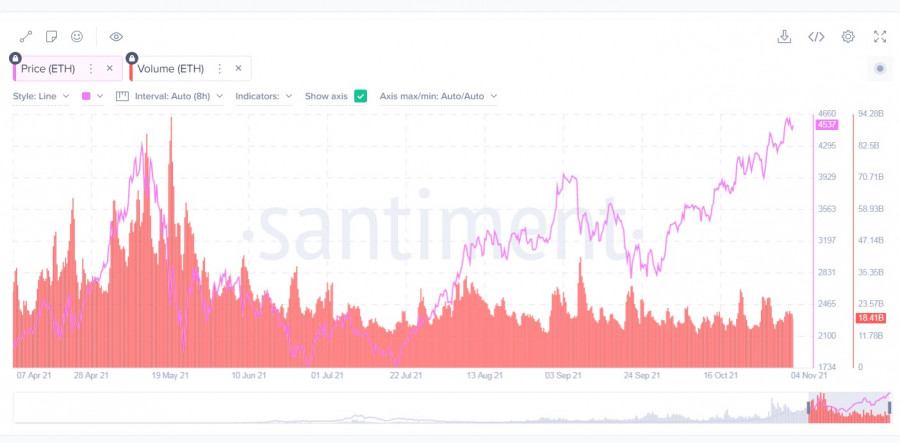
In addition, there is an atypical situation when investors are in no hurry to fix profits, despite the establishment of several historical records in a short period of time. This suggests that traders continue to play for an increase and are waiting for more profitable positions to exit the asset.
The NPL indicator reflects the lack of demand for the sale of ether, which suggests that the market is overheated. Santiment experts believe that the price continues to grow by inertia, but soon the divergence will reach the point of no return, after which a powerful corrective wave will begin.
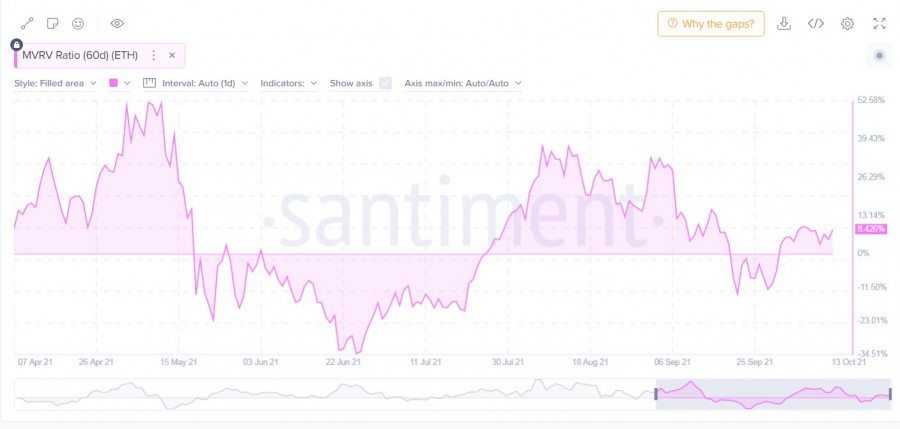
Taking into account the fact that most investors are in the black, according to the MVRV metric, which crossed the +8% mark, we can expect the start of a panic sale in the hope of keeping the maximum profit.
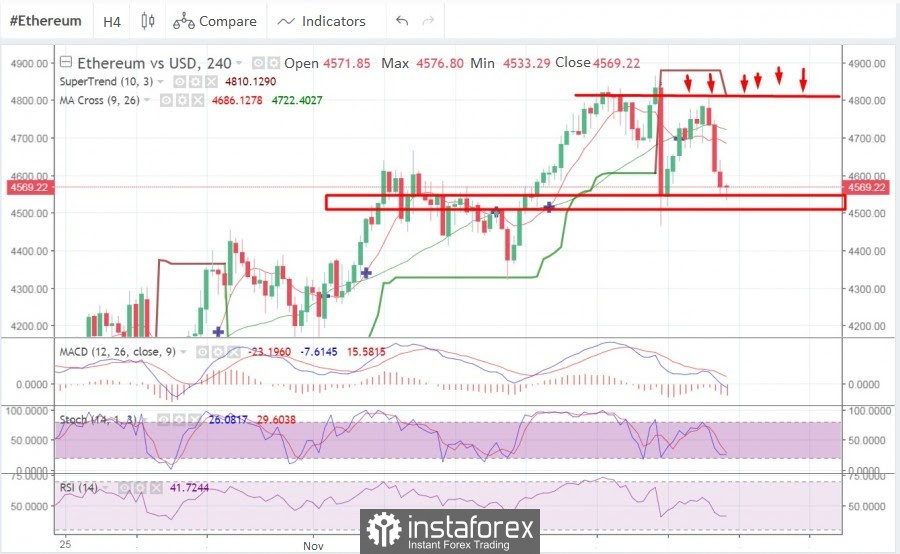
Meanwhile, on the four-hour chart, the cryptocurrency is prone to decline, and sellers' positions are much more confident than buyers. In two days, the price has formed two confident bearish impulse candlesticks, which is a strong signal for a decline. The bulls tried to resume the upward momentum and push the price above the supertrend line, but the quotes failed to pass the resistance zone at $4,800.
Technical indicators of the cryptocurrency also signal a further decline in the price and a move to the support zone at $4,600. The MACD crossed the zero mark and fell into the red zone, which indicates the attenuation of the medium-term upward momentum. At the same time, the stochastic oscillator and the relative strength index demonstrate the prerequisites for recovery: the stochastic moves flat and can form a bullish intersection, and the RSI resumes its upward movement to the bullish zone at around 50.
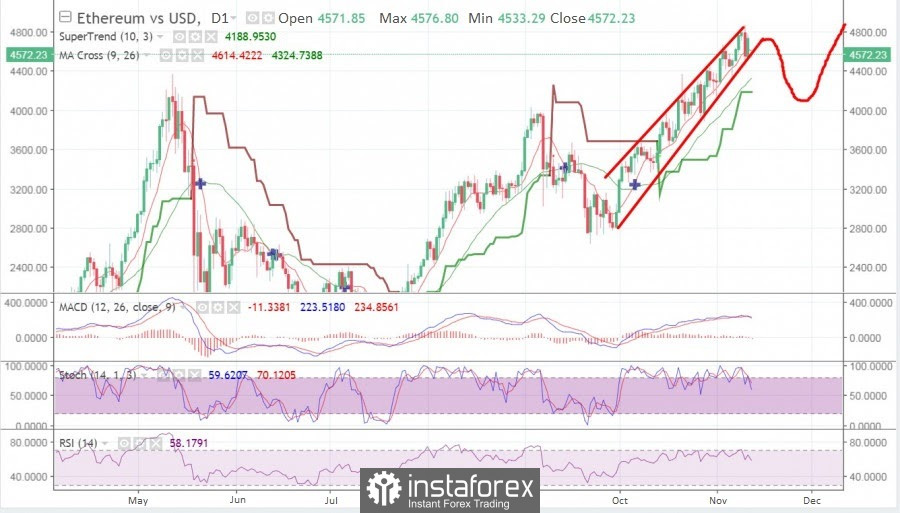
On the daily chart, you can see that the confident medium-term upward trend of the ether has been going on since September 30 and since then the coin has not made a single impulsive decline.
In addition, the previous trading day ended on a bullish note, but with an unpleasant aftertaste, as the bulls failed to contribute to the formation of a "bullish engulfing" pattern. This indicates weak activity of buyers and the growing strength of bears, which will become a catalyst for a downward movement.
Technical indicators also signal the weakness of the upward trend: the MACD formed a bearish intersection and began to decline, while the stochastic and the RSI index are moving towards the 50 mark and risk leaving the bullish zone, which will indicate the complete dominance of sellers.
Considering the on-chain and technical analysis of Ethereum, there is every reason to believe that the coin will go for a correction, which should be taken as normal during a continuous monthly upward trend.
Taking into account that the price has already touched the Fibo level of 1.618, we should expect the start of a correction on the weekend. The nearest key support levels for the cryptocurrency are located in the $4,250-$4,300 zone, but most likely the price will continue to decline to deeper positions.
The most likely places for a rebound will be $3,970 and $3,660, where a new BOOM of activity may occur. It is necessary to take liquidity from this zone after three cost records in two weeks. Such a deep correction contributes to an even more powerful rally, which promises to coincide in the time frame with the full launch of the deflationary protocols of the cryptocurrency.
The material has been provided by InstaForex Company - www.instaforex.com