
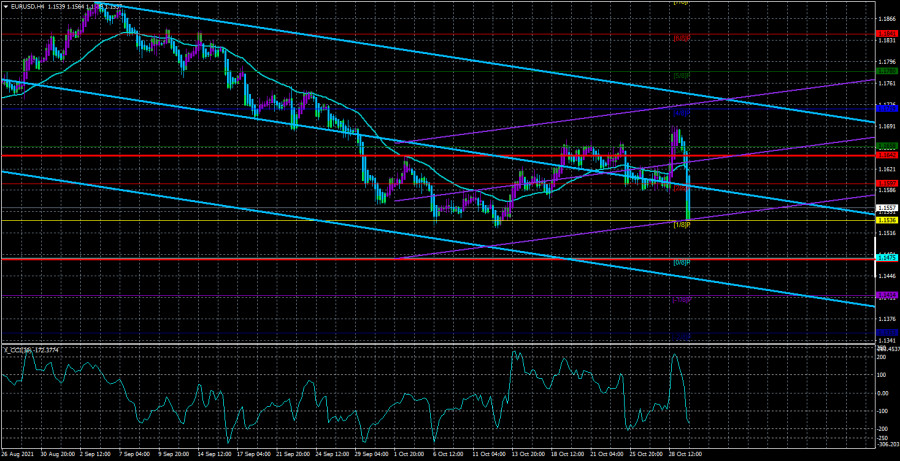
4-hour timeframe
Technical details:
Higher linear regression channel: direction - downward.
Lower linear regression channel: direction - upward.
Moving average (20; smoothed) - downward.
The EUR/USD currency pair traded extremely volatile on Friday. We have already said in our previous articles that the currency pair has set a volatility record for the last 3-4 months for sure, and maybe even more. The illustration below clearly shows how the volatility of the last two trading days does not correspond to the overall picture. And if on Thursday such volatility was due to a really strong fundamental and macroeconomic background, then on Friday, the situation was radically opposite. In the European Union, data on inflation and GDP were published. However, they were just ignored by the markets, and the main fall of the pair occurred during the American trading session when there were no important events. Thus, Friday so far does not fit into the understanding of what is happening. We would even recommend watching the developments in the market for a few days, because if traders found reasons for such strong dollar purchases when there was no reason for it, then what will happen next? We have repeatedly said that the "foundation" can now provide only local support to the US currency. All recent reports have turned out to be weak, and the Fed has real prospects for postponing a decision on curtailing the QE program for December. Therefore, now the dollar should be getting cheaper, not more expensive. Thus, the only reason for the strengthening of the US currency may be "technical long-term". On the 24-hour TF, the pair is still correcting against the upward trend that began a year and a half ago. Therefore, the upward trend may resume at any moment, but for now, it is still a correction, which for the euro has been going on for almost 10 months.
Preview of the new week.
What does the new week have in store for us? Everything will be exceptionally quiet and peaceful in the European Union. The ECB meeting has already been left behind, and in any case, the markets do not pay much attention to macroeconomic reports. Thus, formally, the markets may pay attention to the index of business activity in the manufacturing sector on Tuesday, the unemployment rate on Wednesday, the index of business activity in the services sector and the economic forecast from the European Commission on Thursday, and the change in retail trade volumes on Friday. However, all these data have little chance of affecting the movement of the currency pair. At least, you definitely shouldn't expect such a movement as on Thursday or Friday. Consequently, the reaction of the markets to these events may be in the range of 10-20 points at best. However, a lot will now depend on the volatility indicator.
We have already said earlier that the pair has been moving with reduced volatility in recent months. The normal value of this indicator for the euro is 60-80 points per day. Thus, it is now important to understand whether the euro/dollar pair intends to return to its normal activity indicators or is the last two trading days a pure accident? In the first case, everything changes dramatically. The pair can start moving again so that it can be traded every day, and there will be plenty of trading signals. In the second case, everything will return to normal and we will again wait for one signal in the intraday trading system for two or three days or receive a whole scattering of false ones, and in the Linear Regression Channels system, we will need to keep transactions open for 3-4 days to earn at least something. In the first case, it does not matter at all what the macroeconomic statistics will be during the week, since the maximum that awaits traders is a dozen reaction points. But, of course, the main event of the week – the Fed meeting – should not be overlooked. We will talk about it in more detail in the GBP/USD review.
Here I would like to add that, in principle, now the attention of traders is directed to the States and the Fed. It is very difficult to assume what will happen on the market this Wednesday. It is impossible to predict what decision the Fed will make. It is especially difficult to talk about the possible movement of the pair after what we saw on Thursday and Friday. Thus, the main thing is caution. Do not forget about Stop Loss orders.
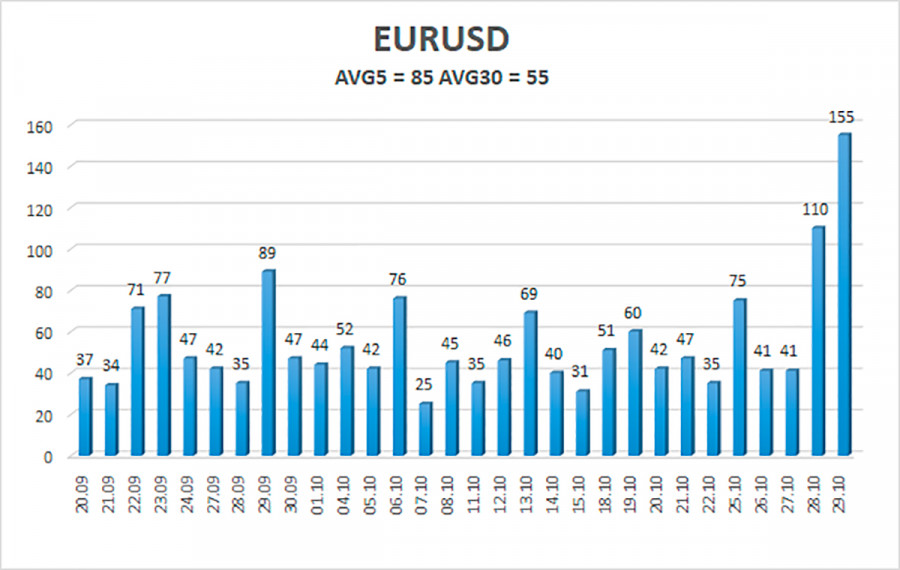
The volatility of the euro/dollar currency pair as of November 1 is 85 points and is characterized as "high". Thus, we expect the pair to move today between the levels of 1.1472 and 1.1642. The upward reversal of the Heiken Ashi indicator will signal a round of upward correction after Friday's fall.
Nearest support levels:
S1 – 1.1536
S2 – 1.1475
S3 – 1.1414
Nearest resistance levels:
R1 – 1.1597
R2 – 1.1658
R3 – 1.1719
Trading recommendations:
The EUR/USD pair has consolidated back below the moving average line, so the trend has changed to a downward one. Thus, today, it is possible to stay in short positions with a target of 1.1475 until the Heiken Ashi indicator turns up. Purchases of the pair should be considered if the price is fixed back above the moving average with targets of 1.1642 and 1.1658 and keep these trades open until the Heiken Ashi indicator turns down.
Explanations to the illustrations:
Linear regression channels - help determine the current trend. If both are directed in the same direction, then the trend is strong now.
Moving average line (settings 20.0, smoothed) - determines the short-term trend and the direction in which to trade now.
Murray levels - target levels for movements and corrections.
Volatility levels (red lines) - the likely price channel in which the pair will spend the next day, based on current volatility indicators.
CCI indicator - its entry into the oversold area (below -250) or into the overbought area (above +250) means that a trend reversal in the opposite direction is approaching.
The material has been provided by InstaForex Company - www.instaforex.com