
GBP/USD 5M
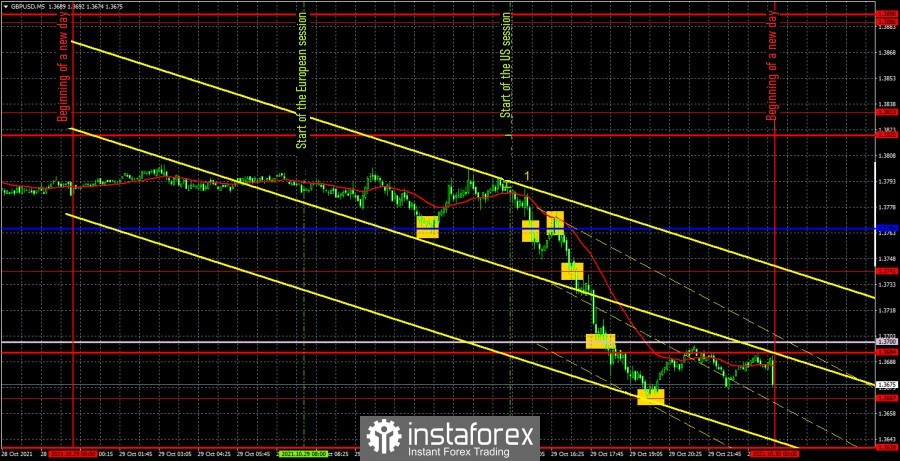
The GBP/USD pair was trading quite interestingly on October 29. After the pound fell ill with the "disease of the euro" and also traded in low volatility for several weeks, the movements were quite active on Thursday and Friday, which is always good. It should be noted right away that there were no reports from the UK on Friday. Likewise, there were no really important statistics overseas. Thus, the drop in the pound's quotes during the US trading session can hardly be attributed to "macroeconomics" or "foundation" at all. Therefore, in the case of the euro/dollar pair, it can hardly be concluded that European reports influenced the collapse of the euro. Thus, most likely it was the US dollar that was in high demand on Friday, which is also very difficult to link with any event. We have already said that in recent months the dollar could rise in price due to the high probability of curtailing the QE program from the Federal Reserve. However, at the same time, the likelihood of folding only decreased, but did not grow in any way. Therefore, this is not the point. We will not be surprised if this week the US dollar comes under pressure to win back the "unfair Friday". Let's take a look at deals now. The price rebound from the Kijun-sen line in the European trading session should have been interpreted as a buy signal. The price managed to go 20 points up after its formation, so the Stop Loss order had to be placed at breakeven. The deal was closed on this order. Then, two sell signals were generated: first, the price crossed the critical line, and then not very accurately, but still bounced off it. Thus, traders should have already sold the pair. Subsequently, the movement became much more pleasant and strong. The price simply broke through the level of 1.3741, the Senkou Span B line, the support level 1.3694 and reached 1.3667 (error of 1 point). Thus, it was around the level of 1.3667 that the profit should be taken on a short position. It was 80 points.
GBP/USD 1H
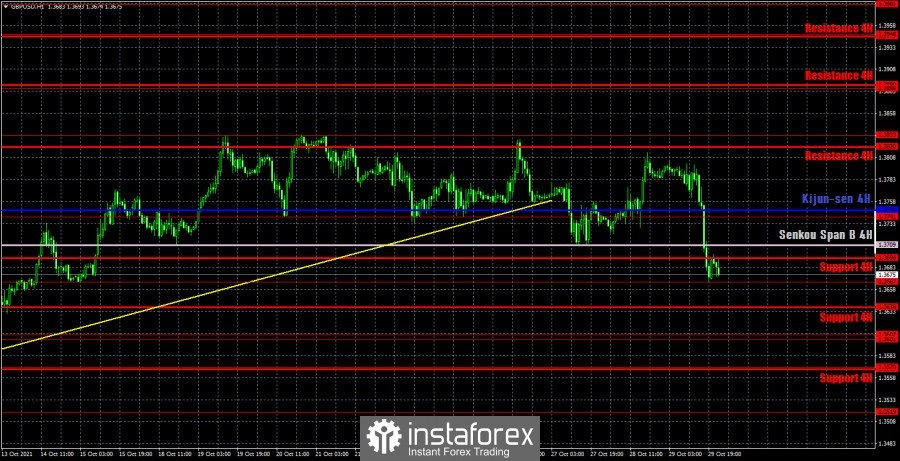
The pound/dollar pair is still trying with all its might to form a downward trend on the hourly timeframe. The downtrend line is still impossible to form, or it will be almost horizontal, which makes no sense. Thus, a round of upward movement may follow on Monday. This is exactly how the pound/dollar pair has been moving in recent weeks: with constant and deep corrections and without a definite direction of movement. We distinguish the following important levels on November 1: 1.3601 - 1.3607, 1.3667, 1.3741, 1.3833. Senkou Span B (1.3709) and Kijun-sen (1.3748) lines can also be signal sources. It is recommended to set the Stop Loss level at breakeven when the price passes 20 points in the right direction. The Ichimoku indicator lines can move during the day, which should be taken into account when looking for trading signals. On Monday, the UK will publish only the not the most significant report on business activity in the manufacturing sector, and in the United States a slightly more important ISM index for the manufacturing sector. Therefore, more attention should be paid to the second report. But even it can be easily and simply ignored if its actual value fails to surprise traders.
We recommend you to familiarize yourself:
Overview of the EUR/USD pair. November 1. The Fed meeting can keep traders in the foreign exchange market.
Overview of the GBP/USD pair. November 1. Two meetings of central banks may end with serious movement of the pound/dollar pair.
Forecast and trading signals for GBP/USD for November 1. Detailed analysis of the movement of the pair and trade deals.
COT report
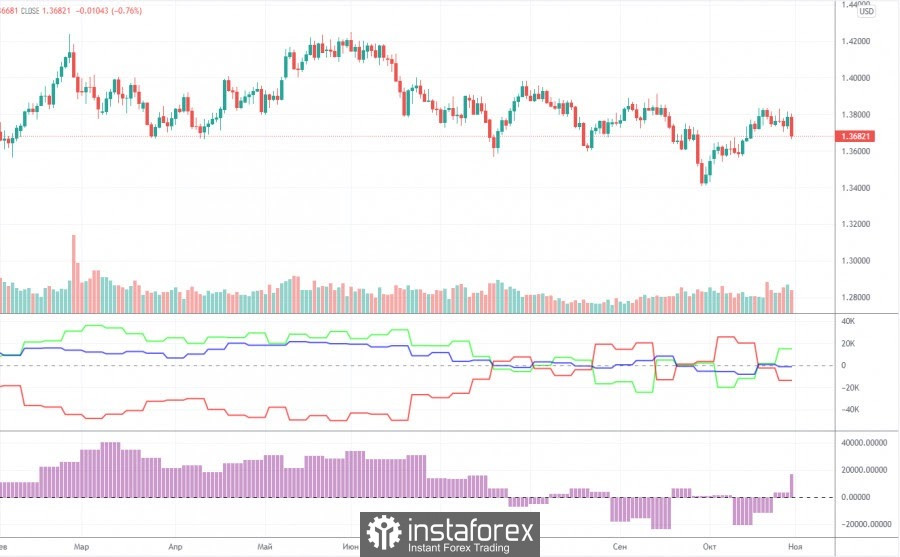
The mood of professional traders became more bullish during the last reporting week (October 19-25). The situation with the COT reports is now even more ambiguous than with the technical picture. And if we compare the COT reports for the euro and the pound, the situation becomes even stranger. Both indicators in the chart above show that the major players still do not have any clear, precise and understandable mood. Consequently, it simply does not make sense to make any forecasts based on COT reports now. The chart above clearly shows the pair's entire movement over the past six months. It is rather difficult to call it a trend or even a trend. In the last couple of months, the mood of the big players has been constantly changing. The green and red lines of the first indicator (net positions of groups of traders "commercial" and "non-commercial") are constantly changing the direction of movement, constantly crossing the zero mark. This means that the two largest groups of traders are constantly increasing and decreasing their net positions. During the reporting week, professional traders opened 2.8 thousand buy contracts (longs) and closed 10.7 thousand sell contracts (shorts). Thus, their net position increased by 10,000 contracts. This is in line with what has been happening with the pound in recent weeks (it is growing). Nevertheless, it is impossible to make a long-term forecast, since the net position may fall already by the end of next week. Especially considering the fall of the pound itself on Friday.
Explanations for the chart:
Support and Resistance Levels are the levels that serve as targets when buying or selling the pair. You can place Take Profit near these levels.
Kijun-sen and Senkou Span B lines are lines of the Ichimoku indicator transferred to the hourly timeframe from the 4-hour one.
Support and resistance areas are areas from which the price has repeatedly rebounded off.
Yellow lines are trend lines, trend channels and any other technical patterns.
Indicator 1 on the COT charts is the size of the net position of each category of traders.
Indicator 2 on the COT charts is the size of the net position for the non-commercial group.
The material has been provided by InstaForex Company - www.instaforex.com