
Gold price is trading above $1,800 after reaching earlier as high as $1,814. Gold price is showing reversal signs as we expected. In our previous posts we noted the increased chances of a trend reversal in Gold as the double bottom around $1,780 and the bullish RSI divergence signals, were enough to make me bullish.
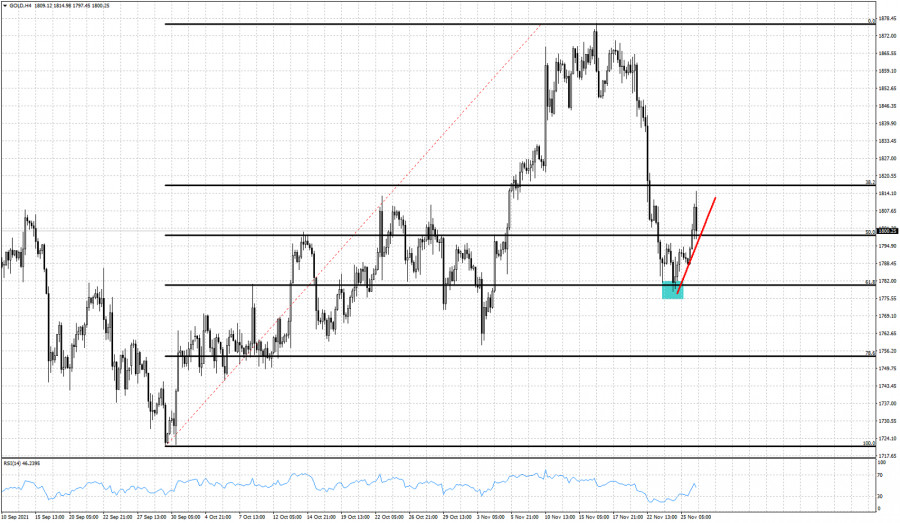
Blue rectangle - support
Red line -expected path
Gold price so far has been following our expected path higher. Price has held the 78.6% Fibonacci retracement and is now moving higher. Resistance is at $1,815 where we also find the 38% Fibonacci retracement of the latest decline from $1,870. Price has started making higher highs and higher lows. In order for trend to change this pattern must continue higher and break above $1,815. The RSI has started turning higher in the 4 hour chart and since it has not reached the overbought area, there is still room for some upside.
The material has been provided by InstaForex Company - www.instaforex.com