
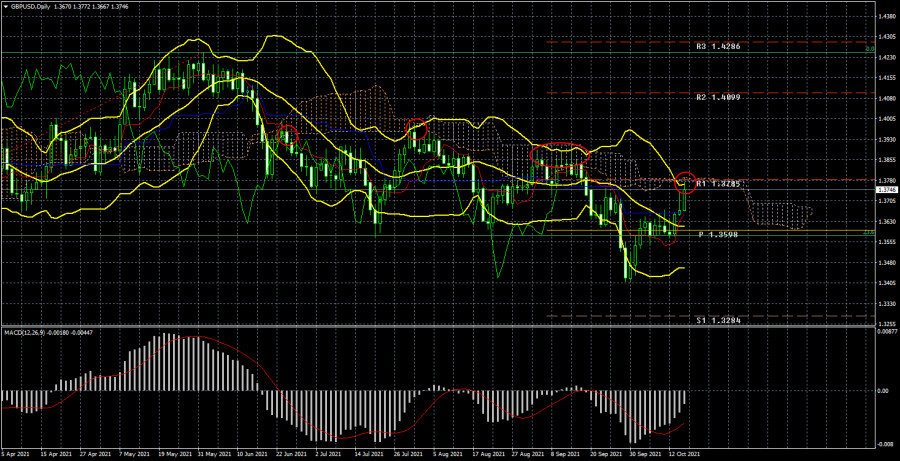
What can I say about the pound on the eve of a new trading week? The pound/dollar pair has been in an upward movement for three weeks. Unlike the European currency. And this, from our point of view, is a very important point that should be taken into account. What does it mean? Usually in such cases, the conclusion suggests itself that at this time the pair is influenced not by US factors, but by European or British ones. That is why there is a correlation between the two main pairs, which trade very similarly most of the time. However, at this time, neither the European Union nor the UK received really important news that could lead to such a reaction of the markets. Recall that three weeks ago a "fuel crisis" broke out in the UK, but a lot of time has passed since then and all this time the pound has been rising. And in total, it has already grown more than it lost three weeks ago. Therefore, this upward movement can no longer be called a "recovery after the collapse." From our point of view, there are two possible explanations for the current situation. The first is an absolute random. That is, what is happening now with the pound/dollar pair is a banal accident. This also happens in the foreign exchange market when a particular movement cannot be explained and justified. But we still try to avoid such explanations, so we offer the second option: at this time everything depends on technique, and foundation and macroeconomics have no meaning. This assumption is partly confirmed by the movement of the euro/dollar pair, which also moves in complete contradiction with the foundation and macroeconomics. And the technical picture of the 24-hour TF now suggests that either the pair is in a new round of correction, which is painfully similar to those that have already been during the current downtrend segment, or a new upward trend has begun, which we have been waiting for for several months. And most importantly, the pair is now near the Senkou Span B line, so in the next couple of days we will be able to understand what is happening now: a correction or a new trend?
Despite the fact that the markets persistently ignore macroeconomic data, especially those coming from the UK, it is still not worth ignoring them. There won't be a lot of significant events next week, however, something can be taken into account. On Monday and Tuesday, there will be nothing interesting either in Great Britain or across the ocean. The only report on US industrial production is unlikely to cause at least some reaction from the markets. On Wednesday, the situation will become a little more interesting, as a report on inflation will be published in Britain, which is now widely considered one of the most important indicators, since most quantitative easing programs are tied to it. To inflation and to the recovery of the labor market. In September, inflation is forecast unchanged and may reach 3.2% y/y. The minimum deviation from the forecast value is unlikely to be the reaction of the markets, nevertheless, there is still a probability of movements here. On Friday, a report on retail sales for September will be released in the UK (also far from the most important report at this time), as well as business activity indices in the services and manufacturing sectors of the UK and the US. The same thing. It turns out that the most significant report of the week will be British inflation... And this means, in turn, that 90% of the time next week the pound/dollar pair will be traded under the influence of technical factors or global fundamentals.
Recall that at this time, the pair may still be under the influence of such a global factor as the Federal Reserve's injection of hundreds of billions of dollars into the American economy as part of the QE program. The money supply is growing, which negatively affects the US dollar exchange rate. But since no instrument can move in the same direction all the time, corrections still happen from time to time. This is exactly the time it could have been in the last 6-7 months, when the pound/dollar pair moved away from its three-year highs and adjusted by 30% or so. From our point of view, it is the fact that the pound has adjusted so weakly that indicates a high probability of a resumption of the global upward trend. Plus, we recall that if we take the highest TF (weekly or monthly), then it is clearly visible that the last global downward trend is probably over. If so, then a new global upward trend has begun and it can last 8-12 years. Consequently, the British currency can continue to grow in the long term.
Recommendations for the GBP/USD pair:
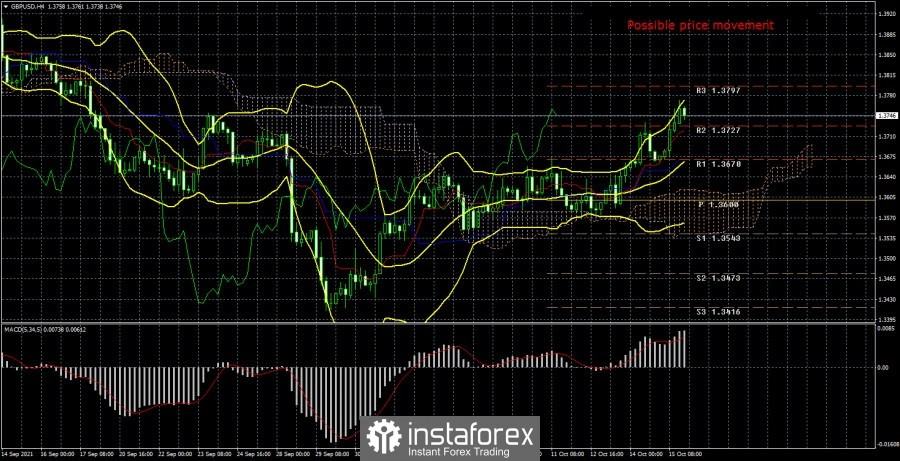
The pound/dollar pair on the 4-hour timeframe continues its upward movement and so far there are no signs of its completion. All indicators are directed upwards, so we advise you to continue buying the pound with an eye to the level of 1.3776, where the Senkou Span B line, which is a powerful resistance, lies on the 24-hour timeframe. A rebound from this line is almost guaranteed to happen. The only question is how strong it will be and will the upward movement resume after it? If not, then a new downward trend may start at the 4-hour TF.
Explanations for the chart:
Price levels of support and resistance (resistance/support), Fibonacci levels - levels that are targets when opening long or short positions. You can place Take Profit levels near them.
Indicators Ichimoku (standard settings), Bollinger Bands (standard settings), MACD (5, 34, 5).
The material has been provided by InstaForex Company - www.instaforex.com