
The pair traded upward on Tuesday and broke through the historical resistance level 1.3481 (blue dotted line). Today, the price may continue to move upward. As per the economic calendar, dollar news is expected at 15:00 and 15:30 UTC.
Trend analysis (Fig. 1).
The market may continue to move upward from the level of 1.3496 (closing of yesterday's daily candlestick) with the target at the upper fractal 1.3623 (red dotted line) - a daily candlestick from 12/17/2020. In case of testing this level, the upward trend may continue with the next target of 1.3676 - a 76.4% retracement level (yellow dashed line).
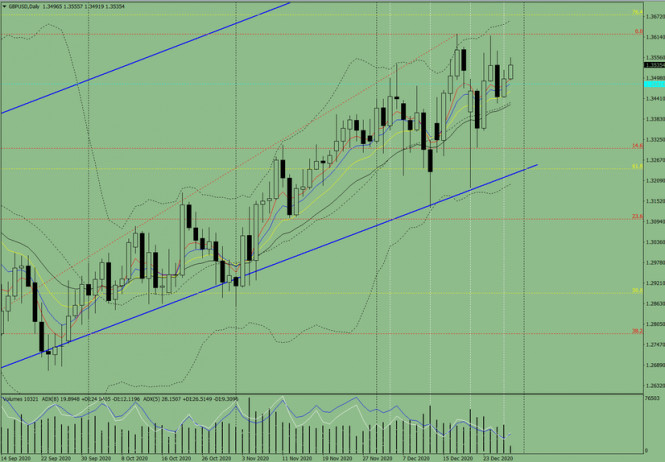
Figure: 1 (daily chart).
Comprehensive analysis:
- Indicator analysis - up;
- Fibonacci levels - up;
- Volumes - up;
- Candlestick analysis - up;
- Trend analysis - up;
- Bollinger lines - up;
- Weekly chart - up.
General conclusion:
Today, the price may continue to move upward from the level of 1.3496 (closing of yesterday's daily candlestick) with the target at the upper fractal 1.3623 (red dotted line) - the daily candle from 12/17/2020. In case of testing this level, the upward trend may continue with the next target of 1.3676 - a 76.4% retracement level (yellow dashed line).
Alternative scenario: the price may continue to move upward from the level of 1.3496 (closing of yesterday's daily candlestick) with the target at the upper fractal 1.3623 (red dotted line) - the daily candle from 12/17/2020. In case of testing this level, a downward trend is possible with the target at the historical support level 1.3481 (blue dotted line).
The material has been provided by InstaForex Company - www.instaforex.com