
EUR/USD 15M
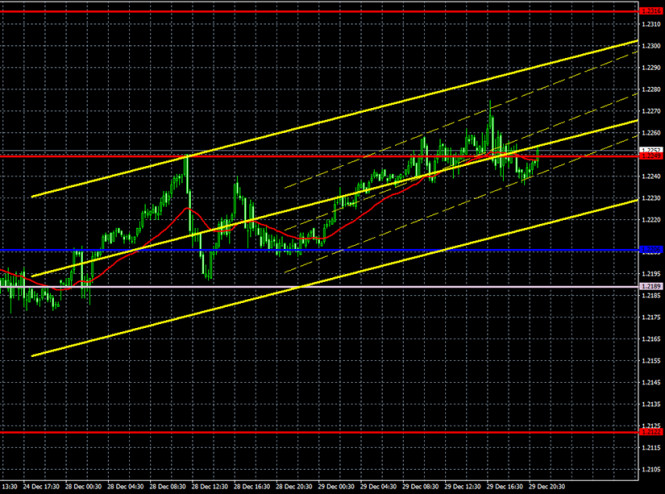
Both linear regression channels turned to the upside on the 15-minute timeframe, so the trend's direction does not raise any questions. The pair is now likely to aim for the 1.2316 resistance level.
EUR/USD 1H
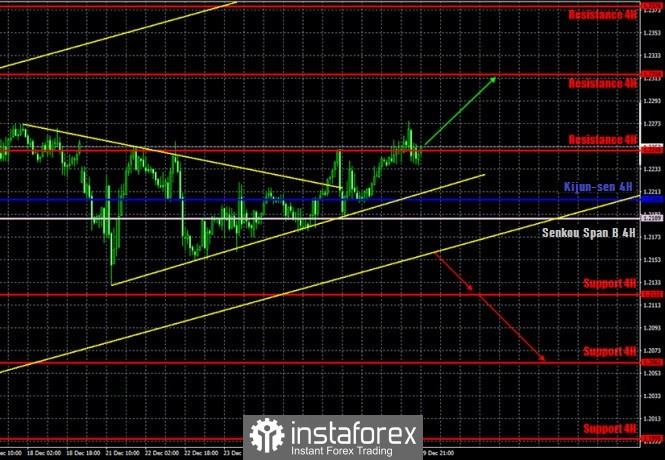
The EUR/USD pair continued to move up on the hourly timeframe on December 29, after failing to overcome the rising trend line. Thus, the upward trend is still present, and the euro is becoming more expensive again, no matter what. Neither the foundation, nor technique, nor the holiday status are capable of stopping the dollar from falling at this time. The pair's quotes overcame the resistance level of 1.2249 yesterday. Thus, the likelihood of growth increases even more. Yesterday, we advised you to open new buy positions if the price rebounds off the critical line or trend line. The pair rebounded off the Kijun-sen line, so buyers could earn another 30-40 points. Volatility has slightly eased in recent days, but the upward trend still persists. This is evidenced by both the trend line and the rising channel.
COT report
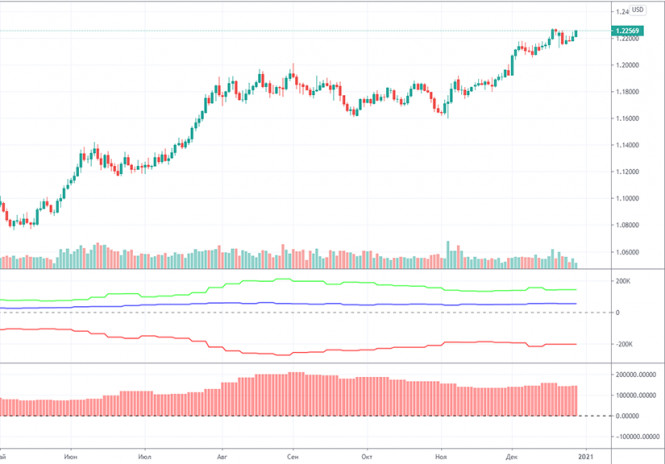
The EUR/USD pair increased by 80 points during the last reporting week (December 15 - 21). Recall that over the past few weeks, the Commitment of Traders (COT) reports have shown an increase in the net position of non-commercial traders, but then it plummeted; the last COT report showed that it fell by 16,000 contracts at once. Professional traders had the tendency to sell off the euro a week earlier, which, as we can see, did not affect the upward trend in any way. The trend has continued and is still present to this day. The latest COT report, which was published two days late due to the holidays, showed that non-commercial traders have again begun to build up contracts to buy the euro. In total, about 4,000 of them were opened during the reporting week and around 300 sales contracts were closed. Thus, the net position for this group of traders began to grow again, as did the euro itself. Indicators below the chart eloquently characterize what is happening. The first indicator shows that the green and red lines have begun to move away from each other again, which means the trend continues. Although in early September these lines diverged very strongly and everyone expected the upward trend to end. However, over the next three months, the bears did not find the strength to take action, so the upward trend is still preserved. The second indicator signals an increase in the net position of professional traders, which, in other words, means a strengthening of the bullish mood.
No important event or macroeconomic report for the euro or dollar on Tuesday. However, this did not prevent traders from buying the euro again, which caused the pair to rise. Thus, as we can see, there is a trend that cannot be violated by either the fundamental background or by macroeconomic reports. Simply because neither one nor the other is present at this time.
No serious events planned for the coming days both in the United States or in the European Union. Hence the fundamental background, unless something extraordinary happens, will be completely absent this week. Consequently, traders will have to trade in pure technique. As long as the upward trend persists, it is possible and even necessary to trade. But as soon as the pair slips into a flat or a swing (moving in different directions) begins, it is recommended to leave the market.
We have two trading ideas for December 30:
1) Buyers keep the initiative in their hands. They managed to keep the pair above the trend line, therefore, chances of continuing the upward movement remain. You are advised to open new long positions in case the price rebounds from the trend line or from the Kijun-sen line while aiming for 1.2316. Take Profit in this case can range from 20 to 80 points. It is unlikely that the price at the current levels of volatility will get to this level in just a day, but it can go up by another 40-50 points.
2) Bears remain very weak at this time and cannot surpass the weak upward trend line. You are advised to open short positions if the bears manage to overcome the lower line of the rising channel with targets at the support levels 1.2122 and 1.2062. Take Profit in this case can range from 30 to 90 points.
Forecast and trading signals for GBP/USD
Explanations for illustrations:
Support and Resistance Levels are the levels that serve as targets when buying or selling the pair. You can place Take Profit near these levels.
Kijun-sen and Senkou Span B lines are lines of the Ichimoku indicator transferred to the hourly timeframe from the 4-hour one.
Support and resistance areas are areas from which the price has repeatedly rebounded off.
Yellow lines are trend lines, trend channels and any other technical patterns.
Indicator 1 on the COT charts is the size of the net position of each category of traders.
Indicator 2 on the COT charts is the size of the net position for the "non-commercial" group.
The material has been provided by InstaForex Company - www.instaforex.com