
GBP/USD 15M
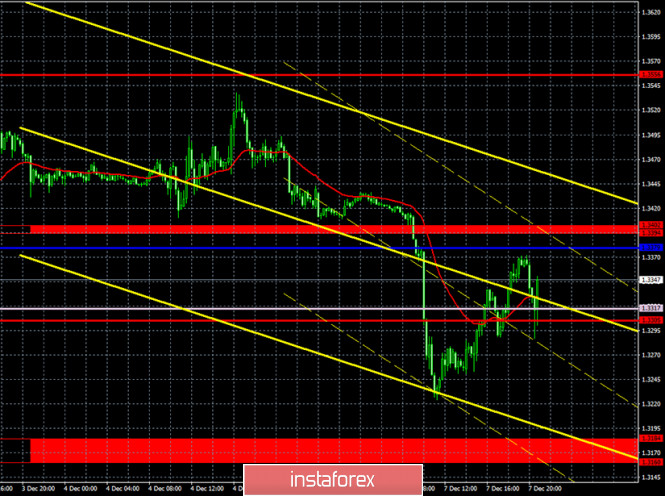
Both linear regression channels turned to the downside on the 15-minute timeframe, which is fully consistent with what is happening on the hourly timeframe. Unfortunately, the first thing that should be highlighted is that the erratic movement persists, which means that in the near future the pair can rise 100-150 points and the end of the upward trend might have been false.
GBP/USD 1H
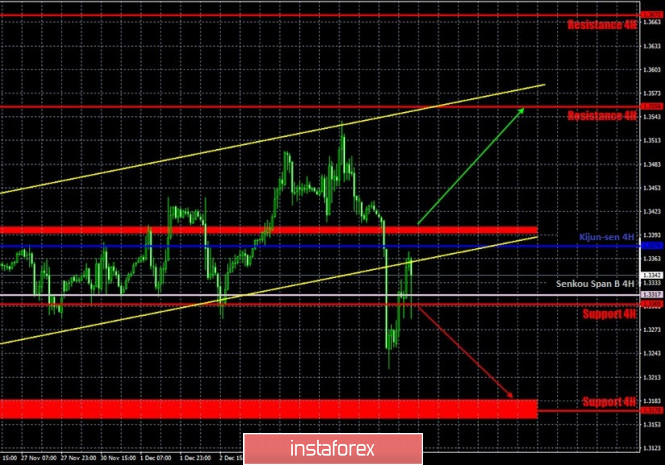
The GBP/USD pair fell 200 points on Monday. The pound recovered by 110-120 points in the afternoon, however, the fall itself was quite impressive. The most important thing is that the pair's quotes have settled below the rising channel, so now we can conclude that the upward trend is over. Over the past weeks, the price has already made similar maneuvers several times, and in general, the pair's movements are more like a "swing" now, so the breakout may be false. Moreover, as we see from the chart, the price did not notice the Senkou Span B line twice, which is generally quite strong. Therefore, we will not be surprised at all if the pair returns to its local highs on Tuesday or Wednesday. By the way, there were no reasons and grounds for the pound's decline on Monday. We mean that there was no unambiguously interpreted news or events that could provoke such a fall. The fact that the pound is too high has been ignored by market participants.
COT report
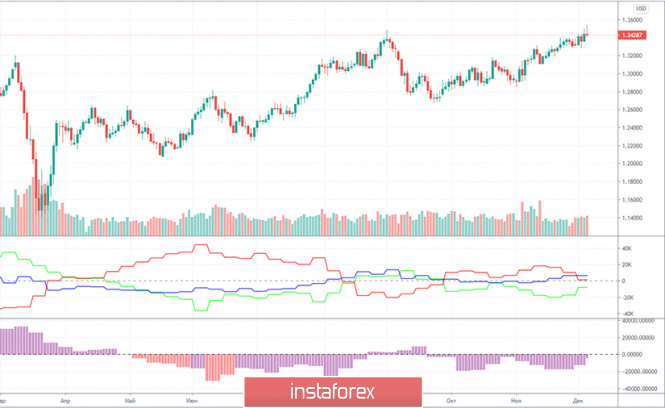
The GBP/USD pair did not grow and did not fall by a single point during the last reporting week (November 24-30). There were no price changes during this period. But in general, there was still an upward trend that extended into the following week. If in the case of the euro/dollar pair, we had been waiting for the beginning of a new downward trend, in the pound/dollar pair's case, the Commitment of Traders (COT) reports did not allow such conclusions to be drawn. You only need to look at both indicators in the chart to understand that there is no trend in the mood of major players. The first indicator constantly shows a shift in the mood of commercial and non-commercial traders from bearish to bullish and vice versa. The second indicator constantly shows that the net position of the "non-commercial" group is growing and decreasing. That is, we can not draw conclusions regarding the pair's future from the COT reports. Non-commercial traders opened 3,600 new Buy-contracts (longs) and closed 4,400 Sell-contracts (shorts) during the reporting week. The net position immediately increased by 8,000, which is a lot for the pound. But there were no price changes. The number of open Buy and Sell contracts for the non-commercial group is practically the same.
The fundamental background for the pound came down to the same topic of Brexit trade talks. Nothing new that concerns the pound. Traders are no longer interested in macroeconomic reports. The pound facing the 35 figure and this seems to be the highest acceptable level for this currency in current conditions. However, we were expecting the pound to sharply fall a few weeks ago, and instead the markets continued to buy it. As such, we advise you to wait until the end of negotiations between Michel Barnier and David Frost, as well as for final verdicts from the European Parliament and the British Parliament regarding the deal (if any). Until there is clarity on this issue, the markets may remain in a very agitated state regarding the pound/dollar pair. And no wonder. The economic future of Great Britain is at stake, and, accordingly, the future of the pound depends on this. The lack of an agreed and ratified trade agreement on January 1, 2021 means a new downturn for the UK economy and a collapse for British business.
No important reports or events scheduled for the EU and the US on Tuesday. As well as Wednesday. Therefore, traders can and should turn their attention to technique and possible news from the negotiation process between London and Brussels. We can't identify any more important factors for the pair at the moment.
We have two trading ideas for December 8:
1) Buyers for the pound/dollar pair have released the initiative from their hands. Now they need to return the pair above the resistance area of 1.3394-1.3402, and only after that should you trade up again while aiming for the resistance level of 1.3556, which is very far away. Take Profit in this case will be up to 130 points. At the same time, the so-called erratic movement persists, which has been going on for two weeks, if not more.
2) Sellers seem to have made a tangible step towards the downward trend, but they nearly missed the pair above the Senkou Span B line. We recommend selling the pound/dollar pair while aiming for the support area of 1.3160 -1.3184, if the quotes return to the area below the Senkou Span B line (1.3317). Take Profit in this case can be up to 100 points.
Forecast and trading signals for EUR/USD
Explanations for illustrations:
Support and Resistance Levels are the levels that serve as targets when buying or selling the pair. You can place Take Profit near these levels.
Kijun-sen and Senkou Span B lines are lines of the Ichimoku indicator transferred to the hourly timeframe from the 4-hour one.
Support and resistance areas are areas from which the price has repeatedly rebounded off.
Yellow lines are trend lines, trend channels and any other technical patterns.
Indicator 1 on the COT charts is the size of the net position of each category of traders.
Indicator 2 on the COT charts is the size of the net position for the "non-commercial" group.
The material has been provided by InstaForex Company - www.instaforex.com