
EUR/USD 15M
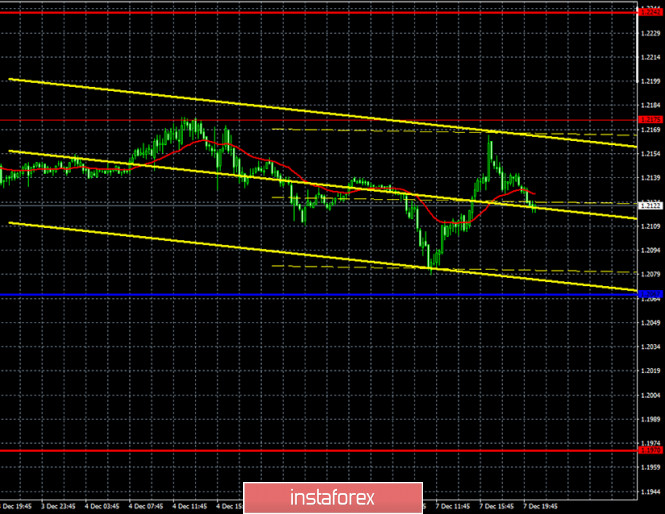
Both linear regression channels began to turn to the downside on the 15-minute timeframe, so the pair has a good chance of continuing the downward correction. We are waiting for the quotes to fall, at least to the Kijun-sen line, around which is the area where the pair's fate will be decided. Accordingly, we expect to see another round of the downward correction.
EUR/USD 1H
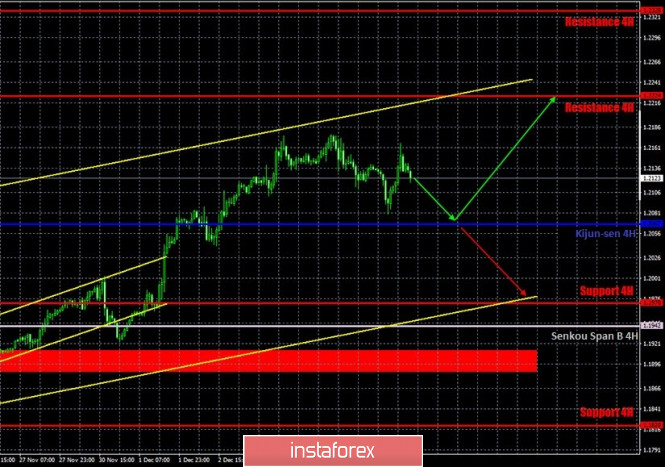
The EUR/USD pair tried to continue the downward correction movement on the hourly timeframe on Monday, December 7, but it could not even reach the Kijun-sen line during the day. And so there was no new buy signal either, since there was no rebound from any Ichimoku indicator line or from any support level, and the upward movement resumed, but Friday's high was not updated. The rising channel sustains the upward trend. By the way, it is wide enough, so breaking this trend will be quite problematic. Nevertheless, you can consider short positions when the pair settles below the critical line. We still believe that the euro is heavily overbought, but most timeframes show that the upward trend will still continue. This means that, whatever the fundamental background is, trading should now be bullish.
COT report
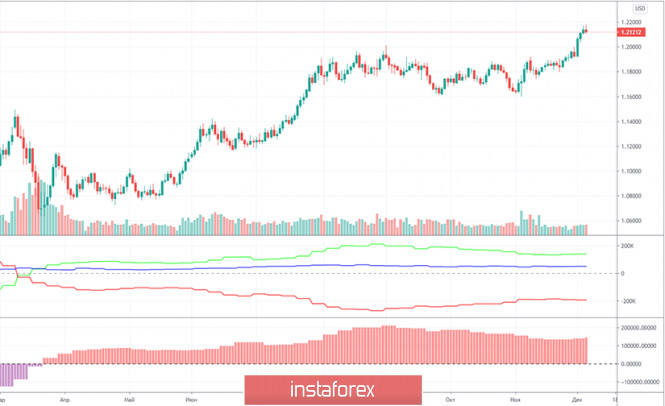
The EUR/USD pair grew by only 80 points during the last reporting week (November 24-30). But the new Commitment of Traders (COT) report indicates that professional traders are becoming more bullish for the second consecutive week. This time, the "non-commercial" group opened 4,300 new Buy-contracts (longs) and closed 300 sell-contracts (shorts). These numbers are not great. Even the general changes in favor of the bulls over the past two weeks cannot be called "breaking the bearish trend". However, the net position of non-commercial traders has been growing for two consecutive weeks. And, apparently, it began to grow synchronously with the resumption of the euro/dollar pair's growth. Unfortunately, COT reports come out three days late. Thus, they can be used to determine the trend, but, as is the case with fundamental analysis, technical confirmation is always required for any conclusions drawn from the COT reports. What do we end up with? The number of open Buy-contracts for professional traders remains high at 212,000, and the number of Sell-contracts is three times less than 67,000. The gap between the two began to narrow around September (the second indicator showing the net position of the non-commercial group), but it is currently growing again. Therefore, we still expect the upward trend to end, because this is what the data of the COT report is implying (especially the first indicator). But we need technical confirmation of this.
No important reports or events from the EU and the US on Monday. Traders still do not need any macroeconomic information. They trade for their own reasons now and it is best to analyze technical patterns on the 1-hour and 4-hour timeframes in order to be aware of everything that is happening. In the coming days, the European Union will resolve the issue with Poland and Hungary, which have blocked the budget and the recovery fund after the pandemic. If the leaders of these countries do not agree to a dialogue with Brussels, they may lose funding from this very budget and fund. From our point of view, Budapest and Warsaw will have to understand and withdraw their veto before the next EU summit, which will take place on December 10-11. Information about this topic will be announced in the coming days.
No important reports or events scheduled for the US on Tuesday. Meanwhile, the EU will publish its GDP for the third quarter in the third estimate. There shouldn't be any surprises since this isn't the first estimate. The European economy lost very little in the second and third quarters (much less than the American economy), but now it is already the fourth quarter, and the European economy should have higher losses. Thus, we are still inclined to believe that the euro should start falling, but we do not recommend opening new short positions until this hypothesis receives technical confirmation.
We have two trading ideas for December 8:
1) Buyers continue to hold the pair in their hands. Therefore, you are advised to continue trading upward while aiming for the resistance level of 1.2224 when the correction ends. A rebound from the Kijun-sen line (1.2067) can now be used as a signal for new long deals. Take Profit in this case can be up to 120 points. You can also look for possible points for long deals near the lower line of the rising channel.
2) Bears are releasing the pair from their hands more and more every day, nevertheless, the current fundamental background allows them to count on a downward reversal soon. Thus, you are advised to open sell orders while aiming for the support level of 1.1970 if the price settles below the Kijun-sen line (1.20511.2067). Take Profit in this case can be up to 70 points.
Forecast and trading signals for GBP/USD
Explanations for illustrations:
Support and Resistance Levels are the levels that serve as targets when buying or selling the pair. You can place Take Profit near these levels.
Kijun-sen and Senkou Span B lines are lines of the Ichimoku indicator transferred to the hourly timeframe from the 4-hour one.
Support and resistance areas are areas from which the price has repeatedly rebounded off.
Yellow lines are trend lines, trend channels and any other technical patterns.
Indicator 1 on the COT charts is the size of the net position of each category of traders.
Indicator 2 on the COT charts is the size of the net position for the "non-commercial" group.
The material has been provided by InstaForex Company - www.instaforex.com