
GBP/USD 15M
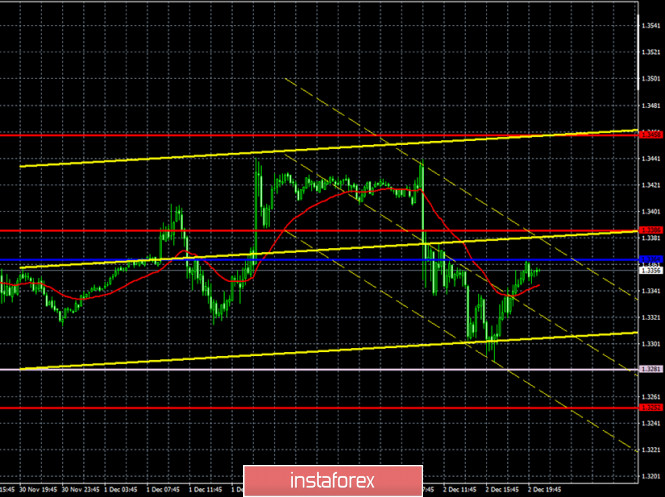
Both linear regression channels turned to the downside on the 15-minute timeframe, which is fully consistent with what is happening on the hourly timeframe, where the direction of movement changes every 12-15 hours. Thus, the key now is the hourly timeframe and its horizontal channel, since the pair is within it again.
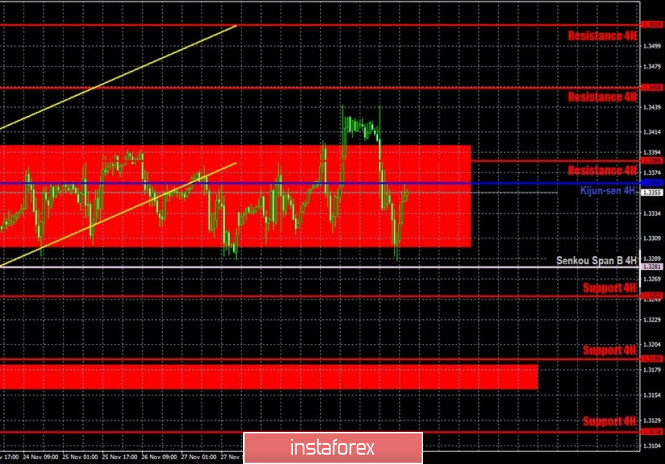
GBP/USD 1H
The GBP/USD pair was free on Wednesday, December 2, finally outside the 1.3300-1.3400 horizontal channel, in which it spent a week. However, even though the price has settled above the horizontal channel, the quotes began a new round of downward movement during the day and fell to the lower line of this channel. The price could not overcome this line, rebounded off it and started a new round of upward movement. This means moving in different directions with almost the same force. As we said in previous reviews, it is very difficult to work out such movements. The pound/dollar pair ignores all technical guidelines, does not pay attention to the foundation and macroeconomics. One can, of course, assume that the problem is in the negotiations on the Brexit trade deal, which are still ongoing. But what is important to us is not why the pound is moving erratically, but when it will end and when will it start to move smoother? When will they be able to trade in the usual mode?
COT report
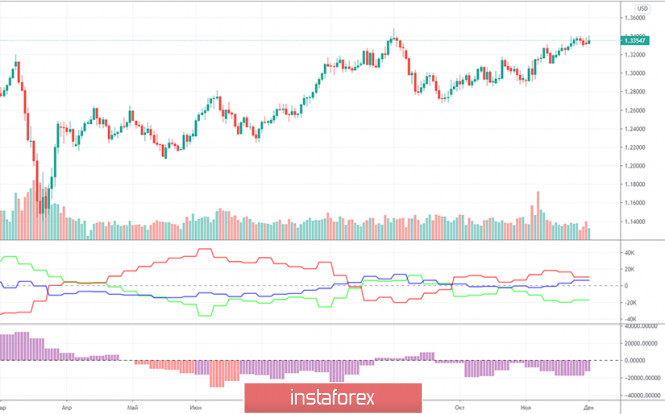
The GBP/USD pair rose by 135 points in the last reporting week (November 17-23), so we can expect professional traders to become even more bullish in the Commitment of Traders (COT) report for this period. And that's what we saw. If the strengthening of the bullish mood came as a very big surprise for the euro's case, this on the other hand is not unexpected for the pound. One has only to look at two indicators that display net positions. The first indicator and its green and red lines are constantly changing the direction of their movement. This means that the net positions of non-commercial and commercial traders are constantly changing their trends. The mood becomes more bullish than bearish. The second indicator also shows that there is no trend in the most important group of non-commercial traders. Their mood also becomes more bullish and vice versa. Therefore, professional traders' desire to buy the pound increased in the reporting week, and next week it may decrease. Therefore, we cannot draw a conclusion, based on the COT report, about the pound's prospects in the coming weeks. Moreover, the foundation predicts its fall, and the technique predicts further growth.
No fundamental background for the British currency on Wednesday. Another few comments from the EU and UK representatives regarding the negotiations on the trade deal, and nothing more. Literally a couple of details about how the negotiations are proceeding, but they do not give us the opportunity to understand how everything will end. More precisely, they enable us to conclude that the parties are still far from concluding a free trade deal. In addition, we would like to note the same ADP report in the US, which, we recall, turned out to be significantly weaker than the forecast values. The euro rose on this report, but the pound, it turns out, fell? Although the movements of both pairs should have been synchronous, if the markets paid attention to this report at all. It turns out that traders again ignored the macroeconomic statistics, and the euro rose in price for its own reasons. And the pound fell for its own reasons. This is how things stand now in the foreign exchange market for the two main currency pairs.
The UK is set to publish a report on business activity in the service sector, which, like the European indices, went below the key level of 50.0. Thus, the British economy will also contract in the fourth quarter, at least due to a repeated lockdown. The US will release a report on applications for unemployment benefits, which has exceeded forecasts in recent weeks. And also the index of business activity in the ISM services sector, which has a forecast of 56, that is much higher than it is necessary to make a conclusion about growth. Therefore, we can get more confirmation that the American economy is doing better than the British, although this does not need confirmation. And, of course, we are waiting for new information on the progress of negotiations on future British-European relations.
We have two trading ideas for December 3:
1) Buyers for the pound/dollar pair did not celebrate for long. At the moment, the pair is within the horizontal channel of $1.33-1.34. Thus, formally, you can try to open long positions while aiming for 1.3458 and 1.3520, if the price settles above the channel again. Take Profit in this case will be up to 90 points. At the same time, there is now a high probability that it could move in different directions, which persisted in the last week.
2) Sellers do not have the upperhand on the situation. We recommend selling the pound/dollar pair with targets at the support levels of 1.3252 and 1.3190 if the bears manage to get the pair to settle below the Senkou Span B line (1.3281). Take Profit in this case can be up to 70 points.
Forecast and trading signals for EUR/USD
Explanations for illustrations:
Support and Resistance Levels are the levels that serve as targets when buying or selling the pair. You can place Take Profit near these levels.
Kijun-sen and Senkou Span B lines are lines of the Ichimoku indicator transferred to the hourly timeframe from the 4-hour one.
Support and resistance areas are areas from which the price has repeatedly rebounded off.
Yellow lines are trend lines, trend channels and any other technical patterns.
Indicator 1 on the COT charts is the size of the net position of each category of traders.
Indicator 2 on the COT charts is the size of the net position for the "non-commercial" group.
The material has been provided by InstaForex Company - www.instaforex.com