
GBP/USD 15M
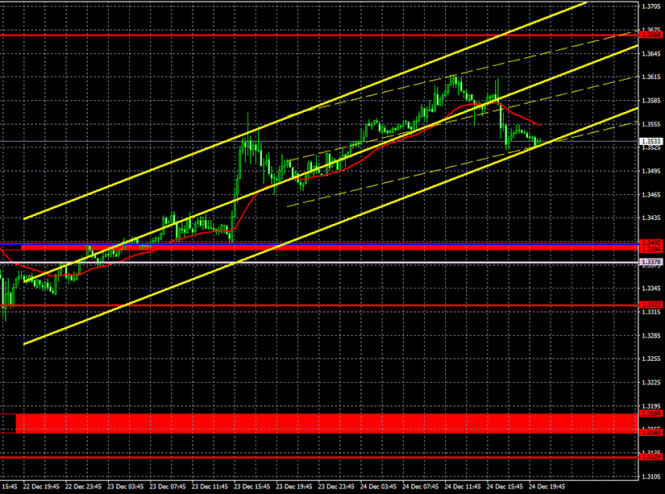
Both linear regression channels are directed to the upside on the 15-minute timeframe. Thus, the upward trend continues in the short-term and there are no signs of it ending at the moment.
GBP/USD 1H
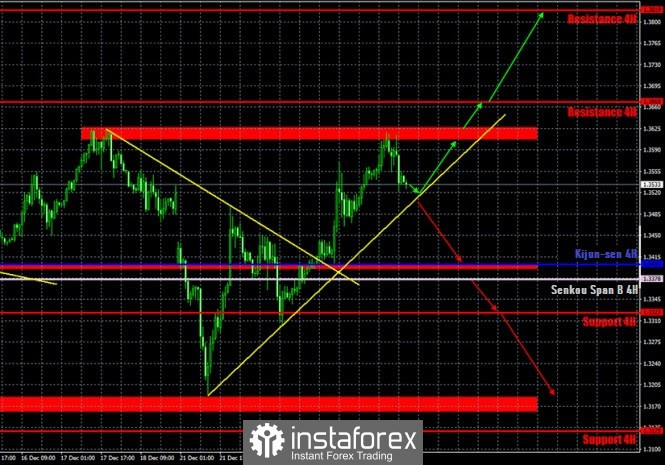
The GBP/USD pair continued the upward movement, which started a couple of days before, on Thursday. The pound had no reason to stand still, like the euro. The EU and the UK had agreed on a trade deal just a week before the end of the transition period. Thus, the markets bought the British pound on a new wave of optimism, until it rose back to the resistance area of 1.3608-1.3628. A rebound occurred from this area and the price began a new round of corrective movement towards the upward trend line. Now everything depends on which of the obstacles the price will overcome. If the area is 1.3608-1.3628, then a new round of upward movement is possible. If there is a trendline, then a downward trend may start. We are still leaning towards the option of starting a downward trend, considering that the pound has exhausted its growth potential a long time ago. Now, when the deal is agreed, and the very fact that traders have already worked this out a bunch of times, we expect a downward movement.
COT report
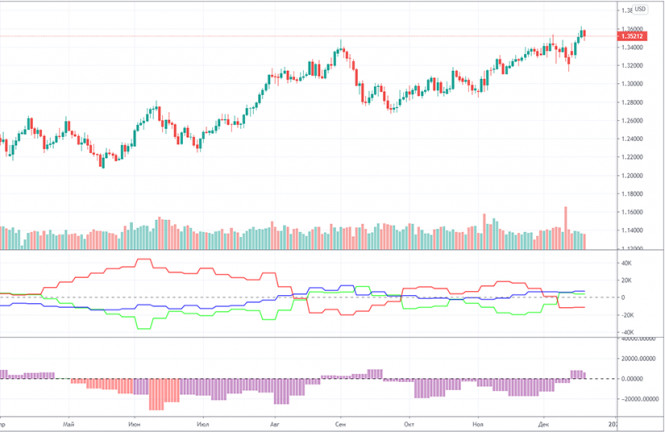
The GBP/USD pair increased by 80 points during the last reporting week (December 8-14). Small price changes, but in general, the pound remains in a steady upward trend. But the latest Commitment of Traders (COT) report gave us data that does not allow us to draw any specific conclusions and forecasts. The changes were minimal and contradictory. Professional traders closed 4,000 Buy-contracts (longs) and 2,300 Sell-contracts (shorts) during the reporting week. Thus, the net position of the most important group of traders decreased by 2,300, which is not much. This means that major players have become more bearish. But it is best to pay attention to the first indicator in order to understand what is happening with the mood of non-commercial traders. The green line (as well as the red one) constantly changes the direction of movement: up and down. This indicates the lack of a clear and firm attitude of the non-commercial group. So now it is impossible to draw any conclusions. The pound has continued to rise for three months (and this is only the last round of its growth), but COT reports do not state that the mood among non-commercial traders became more bullish. Or even that any group of traders at this time actively increased purchases of the pound. The new COT report did not come out on Friday because of Christmas.
The fundamental background for the pound was very interesting on Thursday and the rest of Christmas week. First, the agreement on a trade deal was announced. This time it's official. Closer to the weekend, it became known that the ambassadors of the European Council agreed to temporary approval of the trade deal, after which a personal meeting of all 27 ambassadors took place, at which the text of the draft was discussed. "It will take a few days, because only the basic agreement on trade and cooperation with the EU already includes 1246 pages of legal text," said EU Germany Presidency Spokesman of the EU Council Sebastian Fischer. Thus, the European Council will allow the "temporary application" of the deal without approval and ratification by the European parliament. However, even despite the positive ending of this epic, the absolute majority of experts say that the British economy will still suffer losses due to Brexit. However, we have already mentioned this earlier. The trade deal with the EU is designed only to minimize the risks and losses from the "divorce" of the UK and the EU. The Bank of England, for example, expects a loss of 1% of GDP in the first quarter of 2021 due to Brexit "with a deal". Many agencies and media outlets list a whole list of deterioration that will occur in relations between the EU and Britain.
No news or reports scheduled for Monday. Which is not surprising. We just need to wait for the verdict of the British Parliament, but we believe that there should be no problems with this. The British opposition does not have enough power in Parliament to block the agreement even if it does not suit it. Thus, Prime Minister Boris Johnson can rejoice, and everyone else will study the details of the trade deal, set out on 1246 pages and published on the website of the European Commission.
We have two trading ideas for December 28:
1) Buyers for the pound/dollar pair still have the initiative in the market. At the moment, the upward trend persists, so you are advised to trade up while aiming for 1.3608-1.3628 and the resistance level of 1.3668 when the price rebounds from the upward trend line. Take Profit in this case will be from 70 to 130 points.
2) Sellers are still out of work, but they still have a chance to form a new downward trend in the near future. Thus, we recommend selling the GBP/USD pair while aiming for the Kijun-Sen line (1.3402) if the price manages to overcome the upward line. Take Profit in this case can be up to 110 points.
Forecast and trading signals for EUR/USD
Explanations for illustrations:
Support and Resistance Levels are the levels that serve as targets when buying or selling the pair. You can place Take Profit near these levels.
Kijun-sen and Senkou Span B lines are lines of the Ichimoku indicator transferred to the hourly timeframe from the 4-hour one.
Support and resistance areas are areas from which the price has repeatedly rebounded off.
Yellow lines are trend lines, trend channels and any other technical patterns.
Indicator 1 on the COT charts is the size of the net position of each category of traders.
Indicator 2 on the COT charts is the size of the net position for the "non-commercial" group.
The material has been provided by InstaForex Company - www.instaforex.com