
EUR/USD 15M
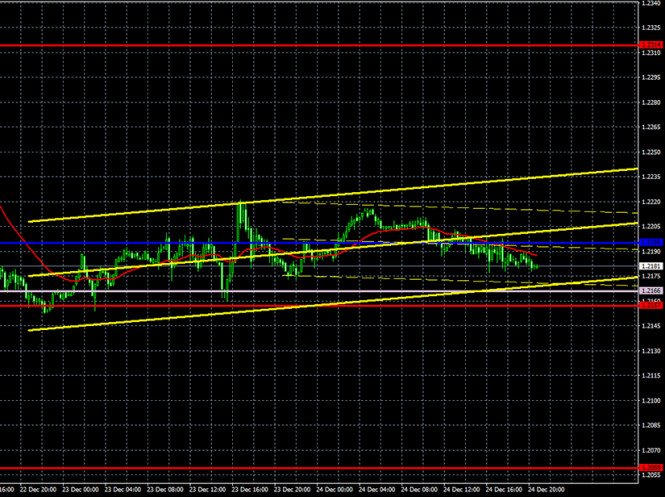
The technical picture is more than eloquent in the 15-minute timeframe. Both linear regression channels are directed sideways, which signals a full flat, at least in the short term. Therefore, if the situation does not change on Monday, then we state a flat and do not recommend trading in it.
EUR/USD 1H
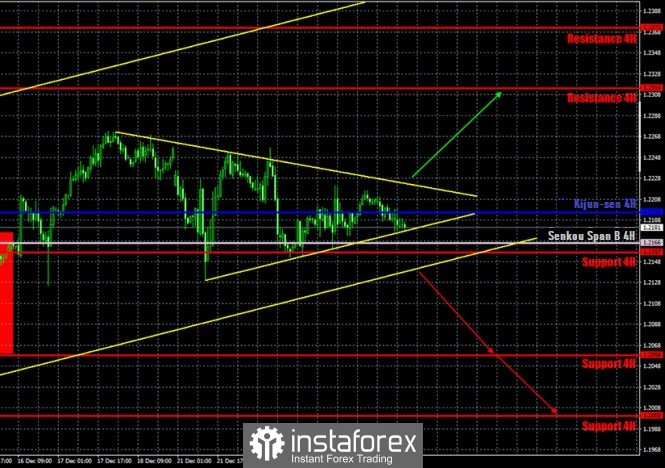
The EUR/USD pair was calmly trading on the hourly timeframe on December 24. Most of the market participants were already celebrating Christmas with their thoughts and preparing for the New Year. We have already said that the New Year's week, which begins with Christmas, is different every year. Sometimes it is overactive, since the market is very thin at this time, sometimes it is super calm, since most traders do not want to trade at this time. This year, so far, everything is moving towards the fact that the New Year's week will be low-volatile and calm. At the moment, the pair's quotes remain between two trend lines, the most important of which is the downward trend. However, in essence, the price remains stuck between these lines and last Thursday, it did not find the strength to leave this range. The pair's quotes dropped to the rising trend line, and the Kijun-sen line was crossed several times, which now speaks of its weakness. In fact, a flat has begun, so both important lines of the Ichimoku indicator, Senkou Span B and Kijun-sen, are not strong now. A signal for a new movement is when the price surpasses any trend line. But even in this case, you need to be careful when making trading decisions, since the price can continue to move sideways and sooner or later will get out of the range. However, such an exit will not be a buy or sell signal.
COT report
The EUR/USD pair increased by 30 points during the last reporting week (December 8-14). Recall that over the past few weeks, the Commitment of Traders (COT) reports have shown an increase in the net position of non-commercial traders. That is, the mood of professional players became more bullish, although before that they were already preparing for a massive sell off of the euro for several months. The non-commercial group closed 5,200 Buy-contracts (longs) and opened 10,800 Sell-contracts (shorts) in the last reporting week. That is, the net position decreased by 16,000, which is quite a lot. Professional players are looking into selling the euro. And if we take the long-term perspective into account, then non-commercial traders continue to lean towards selling the euro. The single currency has been growing for a full nine months. All this time, it has been extremely difficult for the dollar to even adjust. Therefore, the euro is now overbought, and very much so. As for the indicators, they show the same decrease in the net position of non-commercial traders. The green line of the first indicator began to move again to meet the red line (net position of commercial traders), which, we recall, is a signal of the end of the trend. Therefore, we still expect the end of the euro's growth, but at the same time, we remind you that until there are technical signals about the end of the upward trend, it is not recommended to trade down. The new COT report was supposed to be released on Friday, December 25, but due to the celebration of Christmas, it was postponed to Monday.
No important news or reports last Thursday, December 24. So it is not surprising that traders were not active. Also, the holidays have already begun. This week, for example, there are no publications or important events scheduled at all. Thus, market participants can only focus on general topics.
Nothing is happening in the European Union and the United States. The EU has just agreed on a trade deal with the UK, but this event affects the pound more than the euro. Donald Trump continues to be loud in America, who blocked the provision of assistance to Americans and the unemployed, as well as the defense budget, which was previously approved by Congress. Moreover, Trump continues to fight for the election and tries to attract as many people as possible to his side, calling for a review of the results. This time, Trump appealed to Republican senators, urging them to do everything possible to "fight for the presidency." "It's time for Republican senators to step up and fight, as Democrats would have done if they had actually won. The evidence is indisputable." Trump did not consider it necessary to report that he made another unfounded statement from his post.
We have two trading ideas for December 28:
1) Buyers have temporarily released the pair from their hands, but the bears have not significantly pulled the pair down. As long as the price is below the downward trend line, the bearish mood is formally maintained. You are advised to open new long positions if the price settles above the downward trend line while aiming for the resistance level of 1.2314. Take Profit in this case can be up to 80 points.
2) Bears remain very weak at this time and have failed to settle below 1.2157. Moreover, a rising trend line has been created, which restrains sellers from significantly pulling the pair down. Thus, you are advised to open short positions if the bears manage to overcome the lower line of the rising channel in order to target the support level of 1.2058. Take Profit in this case can be up to 80 points.
Forecast and trading signals for GBP/USD
Explanations for illustrations:
Support and Resistance Levels are the levels that serve as targets when buying or selling the pair. You can place Take Profit near these levels.
Kijun-sen and Senkou Span B lines are lines of the Ichimoku indicator transferred to the hourly timeframe from the 4-hour one.
Support and resistance areas are areas from which the price has repeatedly rebounded off.
Yellow lines are trend lines, trend channels and any other technical patterns.
Indicator 1 on the COT charts is the size of the net position of each category of traders.
Indicator 2 on the COT charts is the size of the net position for the "non-commercial" group.
The material has been provided by InstaForex Company - www.instaforex.com