
GBP/USD 15M
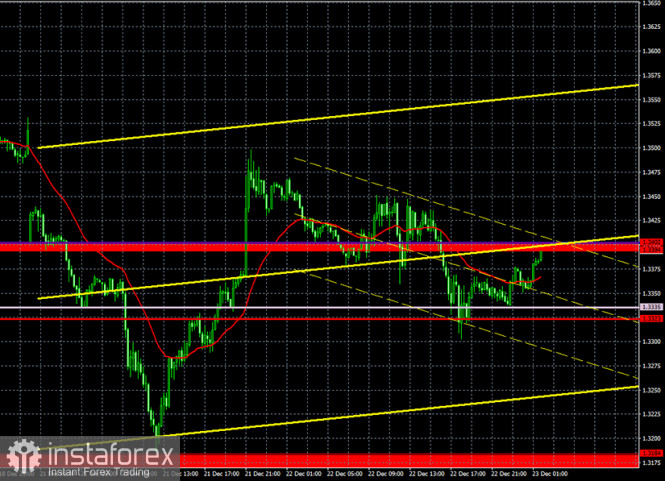
The higher linear regression channel is directed sideways on the 15-minute timeframe, the lower one is downward. A downward trend has appeared in the short-term, but further downward movement will depend on surpassing/not being able to surpass the Senkou Span B line.
GBP/USD 1H
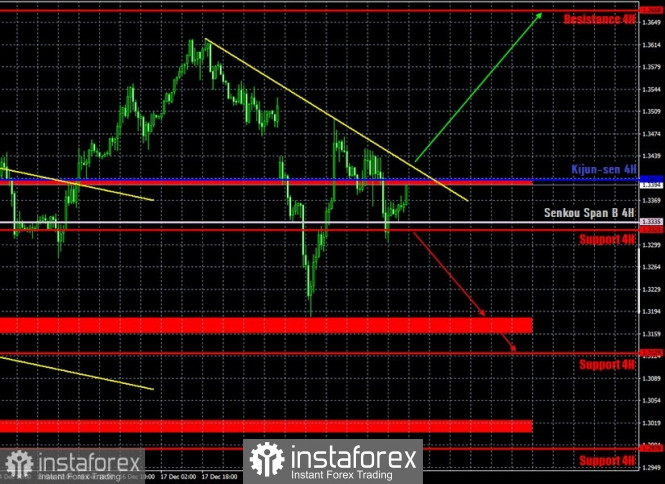
The GBP/USD pair tried to bring back the downward movement on Tuesday and it, in principle, succeeded. The price did not make any new attempts to establish itself above the downward trend line, successfully surpassed the critical line and reached the Senkou Span B line at the end of the day along with the support level of 1.3323. Thus, as in the case of the euro, the succeeding downward movement will depend on the Senkou Span B line. If the bears manage to push it, then it will continue to fall to the support area of 1.3160-1.3184. Otherwise, the bulls will try to bring back the upward trend again. The fact that the holidays are approaching is actually making the market analysis more difficult. Movements in the foreign exchange market can only become more complex and even less predictable. Thus, we warn you that the pair has been trading illogically and unreasonably for most of 2020 and may continue to do so in its last days. Although, of course, we are hoping for the best.
COT report
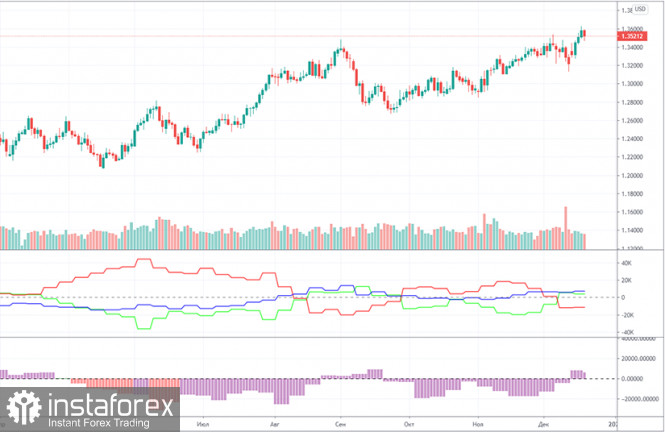
The GBP/USD pair grew by 80 points in the last reporting week (December 8-14). Slight price changes and the overall upward trend are still present for the pound. But the Commitment of Traders (COT) report in the last reporting week gave us data that does not allow us to make any specific conclusions and forecasts. The changes were again minimal and contradictory. Professional traders closed 4,000 Buy-contracts (longs) and 2,300 Sell-contracts (shorts) during the reporting week. Thus, the net position of the most important group of traders decreased by 2,300, which is not much. This means that major players have become more bearish. But the best thing to do now is to pay attention to the first indicator in order to understand what is happening with the mood of non-commercial traders. The green line (as well as the red one) constantly changes the direction of movement: up and down. This speaks precisely of the lack of a clear and firm attitude of the "non-commercial" group. So now it is impossible to draw any conclusions at all. The pound has been rallying for almost three months (and this is only the last round of its upward movement), but the COT reports does not show that non-commercial traders are becoming more bullish at this time. Or that any group of traders at this time are actively increasing purchases of the pound.
The fundamentals for the pound remained the same on Tuesday just like it did in recent months. It continues to boil down to talks on the trade deal between the groups of Michel Barnier and David Frost. Negotiations seem to be moving forward, but time is too short. Thus, we believe that in the end the parties will either prolong the transition period (the European Union again proposes such an option, and Prime Minister Boris Johnson stubbornly refuses), or they will ratify the deal "retroactively". One way or another, so far it does not seem that the parties will allow the absence of an agreement. Although anything is possible. No one thoroughly and reliably knows what Barnier and Frost have agreed on and are negotiating about. It is possible that the terms of the future deal will not suit some EU countries or British MPs who are very fond of blocking deals with the EU. The UK GDP for the third quarter was also published yesterday, which slightly exceeded the forecast values. However, the pound received very weak support in the morning.
No major reports or events scheduled for Wednesday in the UK. We continue to observe and wait for the outcome of the negotiations between Britain and the EU. There is nothing more to do. US macroeconomic reports may have an impact on the pound/dollar pair's movements on Wednesday, but only if the actual values differ greatly from the forecast. The topic of a new strain of coronavirus quickly died down when it became known that there were about a dozen more strains. Thus, the markets continue to calm down after a crazy Monday. Nevertheless, on the eve of the holidays, volatility may rise again, and the pair may start to move erratically again.
We have two trading ideas for December 23:
1) Buyers for the pound/dollar pair have taken a break for now and are watching the development of events. They need to bring the pair back to the area above the downward trend line. It is possible to trade up again when the quotes have finally settled above the trend line, the first target would be the resistance level of 1.3668, which is located very far away. Take Profit in this case will be up to 200 points, but it may take several days to cover this distance.
2) Sellers have a good chance of trading down, since the pair is staying below the trend line. Thus, we recommend selling the pound/dollar pair again while aiming for the support area of 1.3160-1.3184 and the 1.3129 level, if the price manages to overcome the Senkou Span B line (1.3335). Take Profit in this case can range from 110 to 170 points.
Forecast and trading signals for EUR/USD
Explanations for illustrations:
Support and Resistance Levels are the levels that serve as targets when buying or selling the pair. You can place Take Profit near these levels.
Kijun-sen and Senkou Span B lines are lines of the Ichimoku indicator transferred to the hourly timeframe from the 4-hour one.
Support and resistance areas are areas from which the price has repeatedly rebounded off.
Yellow lines are trend lines, trend channels and any other technical patterns.
Indicator 1 on the COT charts is the size of the net position of each category of traders.
Indicator 2 on the COT charts is the size of the net position for the "non-commercial" group.
The material has been provided by InstaForex Company - www.instaforex.com