
EUR/USD 15M
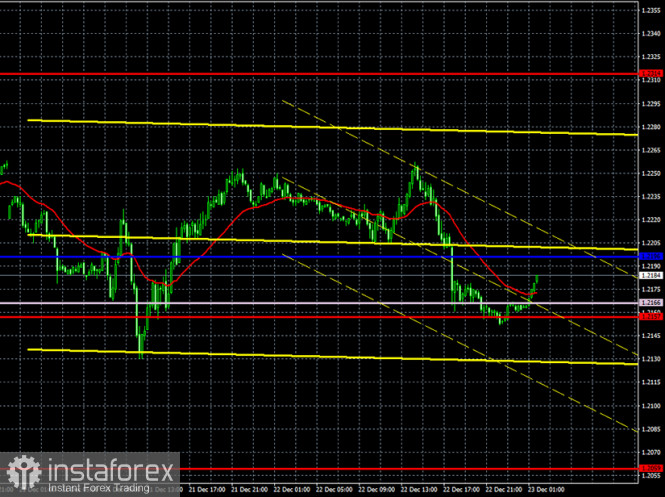
The higher linear regression channel is directed sideways on the 15-minute timeframe, which, in the best possible way, characterizes the current mood of traders. Yes, globally there is an upward trend, in the short-term there is a downward trend, but the whole movement looks more like a horizontal one. The key now is the Senkou Span B.
EUR/USD 1H
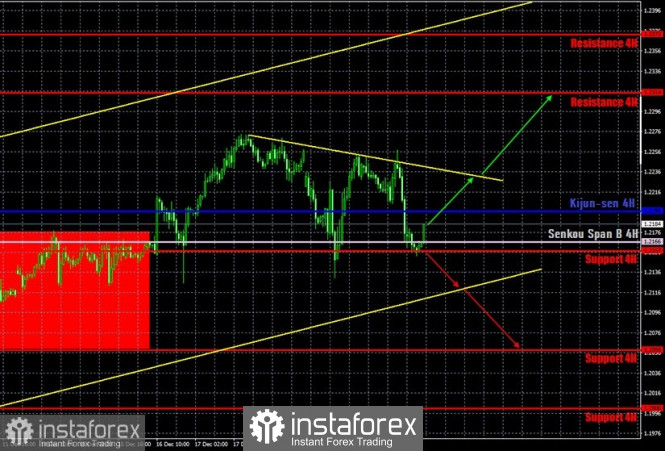
The EUR/USD pair was trading quite predictably on the hourly timeframe on Tuesday, December 22. First, it has once again reached the downward trend line, which has a fairly small slope, which indicates the weakness of the downward trend. Secondly, after rebounding from the trend line, the pair dropped to the Senkou Span B line and the support level of 1.2157, which it could not surpass. Thus, the downward trend continues (short-term), but the upward trend persists in the long-term, as evidenced by the more global upward channel. So, for now, the bears may try to pull down the pair to the lower line of this channel, if they manage to surpass the Senkou Span B line. Further prospects for the dollar will depend solely on the ability of sellers to withdraw the pair from the upward channel. So far, it doesn't look like the bears have enough strength to do this. At the same time, the outlook for bulls is above the downtrend line.
COT report
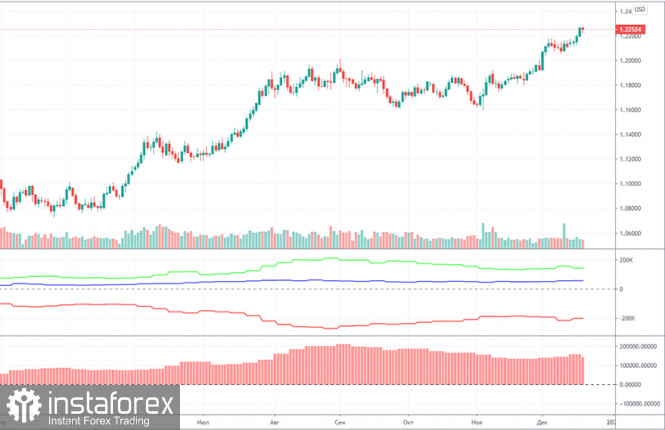
The EUR/USD pair increased by 30 points in the last reporting week (December 8-14). Recall that the last few weeks, the Commitment of Traders (COT) reports have shown an increase in net position among non-commercial traders. Simply put, professional players were becoming more bullish, although before that they had been preparing for a massive sell-off of the euro for several months. The non-commercial group closed 5,200 Buy-contracts (longs) and opened 10,800 Sell-contracts (shorts) in the last reporting week. That is, the net position decreased by 16,000, which is quite a lot. Professional players are looking towards selling the euro again. And if we take into account the long-term perspective, then non-commercial traders continue to lean towards selling the euro. This point is clear and understandable. The euro has been growing for a full nine months. All this time, it is extremely difficult for the dollar to even correct. Therefore, the euro is very much overbought. As for the indicators, they reflect the same decrease in the net position of non-commercial traders. The green line of the first indicator began to move again to meet the red line (net position of commercial traders), which is a signal of the end of the trend. Therefore, we are still expecting the upward movement to end for the euro, but at the same time we remind you that until there are no global technical signals about the end of the upward trend, you are not advised to trade down. There is no need to try to guess the downward reversal.
The markets were finally happy on Tuesday. The US published its third quarter GDP report, and we did not expect traders to pay any attention. However, since the actual value turned out to be higher than forecasted (which was also unexpected), the dollar received additional demand. But it's still a big question as to how long the dollar will continue to rise. At this time, there is not a single global topic that could suggest the pair's movement for the next couple of weeks or a month. We continue to believe that the EU economy will suffer certain losses in the fourth quarter, unlike the American one. Ultimately, this factor plays an important role. Also, the matter is moving towards the Christmas and New Year holidays, which only adds risks for traders.
Several secondary macroeconomic reports will be released on Wednesday. It includes changes in personal income and spending of Americans, the index of personal consumption expenditure, claims for unemployment benefits, orders for durable goods. We recommend that you only pay attention to the latest report. It is not a fact that it will have any influence on the pair's movement. At least the last few did not. However, if the discrepancy between the forecast and the actual value is large, then traders can react to it. The report on applications for unemployment benefits will also be interesting, as the number of initial applications has been growing in the last few weeks
We have two trading ideas for December 23:
1) Buyers have temporarily released the pair from their hands, but the bears are not letting it go far down. The bearish mood is still present while the price is below the trend line. However, buyers can open longs if there is a rebound from the Senkou Span B line (1.2166), with a trendline as a target. Take Profit in this case can be up to 50 points.
2) Bears remain very weak at this time and hardly pull down quotes. It was possible to open short positions on the rebound from the trend line, which can now be kept if the pair overcomes the Senkou Span B line (1.2166) while aiming for the lower line of the rising channel. In this case, Take Profit can be up to 90 points. You are advised to consider short deals after the pair leaves the rising channel.
Forecast and trading signals for GBP/USD
Explanations for illustrations:
Support and Resistance Levels are the levels that serve as targets when buying or selling the pair. You can place Take Profit near these levels.
Kijun-sen and Senkou Span B lines are lines of the Ichimoku indicator transferred to the hourly timeframe from the 4-hour one.
Support and resistance areas are areas from which the price has repeatedly rebounded off.
Yellow lines are trend lines, trend channels and any other technical patterns.
Indicator 1 on the COT charts is the size of the net position of each category of traders.
Indicator 2 on the COT charts is the size of the net position for the "non-commercial" group.
The material has been provided by InstaForex Company - www.instaforex.com