
GBP/USD 15M
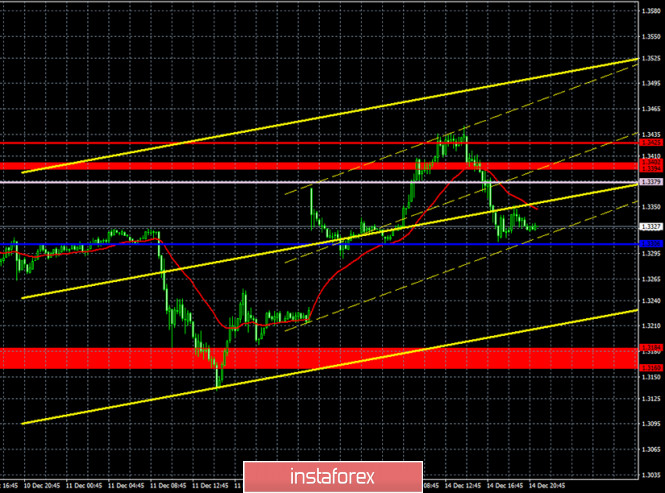
Both linear regression channels are directed to the upside on the 15-minute timeframe. However, they may turn down in the near future in order to work out a very likely downward movement on the hourly timeframe. Rebounding from the resistance level of 1.3425 also adds confidence in continuing the downward movement.
GBP/USD 1H
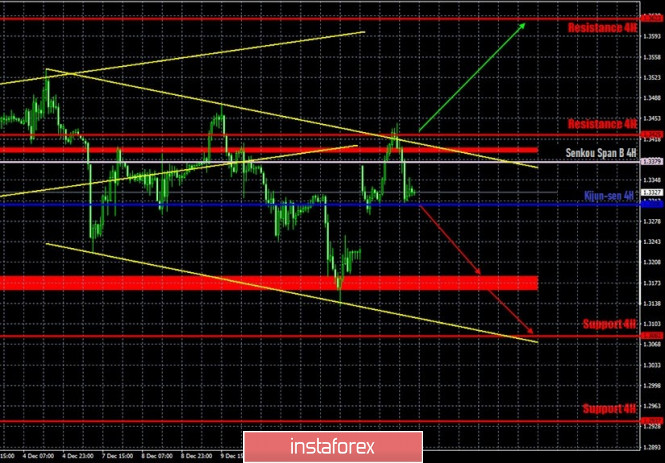
After the GBP/USD pair rebounded from the lower line of the downward channel last Friday, it then rose to its upper border on Monday, as we expected. It did not stop near the critical line, since trading began above this line, which is called "opening with a gap to the upside". And so the quotes reached the upper channel line, rebounded off it and started a new round of downward movement, which perfectly fits the term "high volatility swing". This is what the pound is facing, as it has been uncertain since last weekend. There is more uncertainty as London and Brussels have agreed to continue negotiations, although there is no progress, and just over two weeks before the Brexit deadline. Therefore, it is very difficult to explain what triggered a new fit of optimism among market participants. Now we expect quotes to fall to the area of the lower border of the channel, the potential for a decline is around 200 points.
COT report
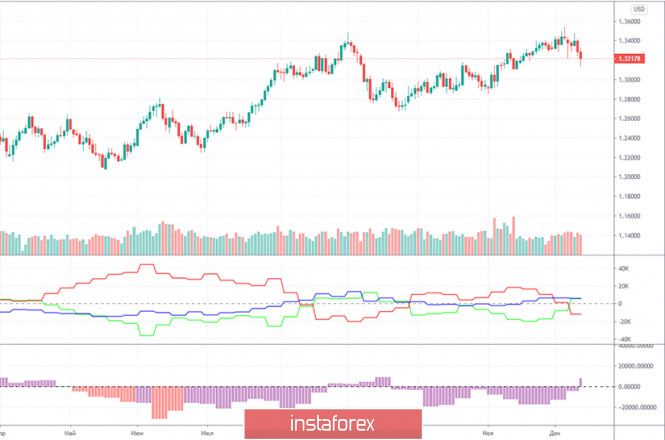
The GBP/USD pair rose by 60 points in the last reporting week (December 1-7). A little, but it's still growth. Although, according to the latest Commitment of Traders (COT) report, such an increase is quite reasonable. A group of non-commercial traders opened 2,866 new Buy-contracts (longs) and closed 9,189 Sell-contracts (shorts) during the reporting week. Thus, the net position for non-commercial traders has increased by 12,000 contracts, which is a lot for the pound, given that the total number of contracts for the "non-commercial" group is approximately 90,000. Therefore, professional traders have increasingly become more bullish, and the total number of contracts has decreased. This suggests that a very small number of large players still want to deal with the pound. This is not surprising given the uncertainty surrounding the future of the UK and its economy. As for the indicators, they have not shown any trend for several months. That is, professional traders do not increase purchases and sales in the long term. Therefore, long-term conclusions cannot be drawn from the COT reports.
No fundamental background for the pound on Monday. I mean, a new background. Because there were no news and events that day. After another inexplicable fit of optimism among traders, the pound failed to get out of the downward trend channel and may now fall by 200 points, but not because market participants no longer believe in the deal, but because this is the technical picture. If traders no longer believed in the deal, the pound would now be trading around the $1.25 level, if not lower. Therefore, there is no point in waiting for the end of the next round of negotiations, since there were already so many of them, and they all ended in nothing. It makes sense to trade only in accordance with the technical picture.
Today the UK is set to publish reports on unemployment rate, average wages and claims for unemployment benefits. In theory, these reports can affect the pair's movements, but in practice there is little chance of this. The unemployment rate could rise to 5.1%, the number of new applications for benefits could reach 50,000, and the average wage could rise by 2.6% m/m. Below forecast readings may support the GBP/USD bears. I should remind you that the technique speaks in favor of sustaining the fall by another 150-200 points. We can say the following about trade negotiations: you need not wait for information about reaching an agreement, but for messages about the completion of the negotiations themselves or their extension to 2021.
We have two trading ideas for December 15:
1) Buyers for the pound/dollar pair, despite the rise by 300 points, have taken a pause for now. They need to return the pair above the 1.3394-1.3402 resistance area and above the downward trend line. There was an attempt to do so yesterday, but it was unsuccessful. You can only trade upward while aiming for the resistance level of 1.3623 after quotes have left the downward channel, which is very far away. Take Profit in this case will be up to 180 points.
2) Sellers have excellent chances for a new decline, since the price failed to leave the downward channel. Thus, we recommend selling the pound/dollar pair again while aiming for the support area of 1.3160 -1.3184 and the lower channel line, since a rebound followed from the upper line. Take Profit in this case can range from 130 to 220 points.
Forecast and trading signals for EUR/USD
Explanations for illustrations:
Support and Resistance Levels are the levels that serve as targets when buying or selling the pair. You can place Take Profit near these levels.
Kijun-sen and Senkou Span B lines are lines of the Ichimoku indicator transferred to the hourly timeframe from the 4-hour one.
Support and resistance areas are areas from which the price has repeatedly rebounded off.
Yellow lines are trend lines, trend channels and any other technical patterns.
Indicator 1 on the COT charts is the size of the net position of each category of traders.
Indicator 2 on the COT charts is the size of the net position for the "non-commercial" group.
The material has been provided by InstaForex Company - www.instaforex.com