
EUR/USD 15M
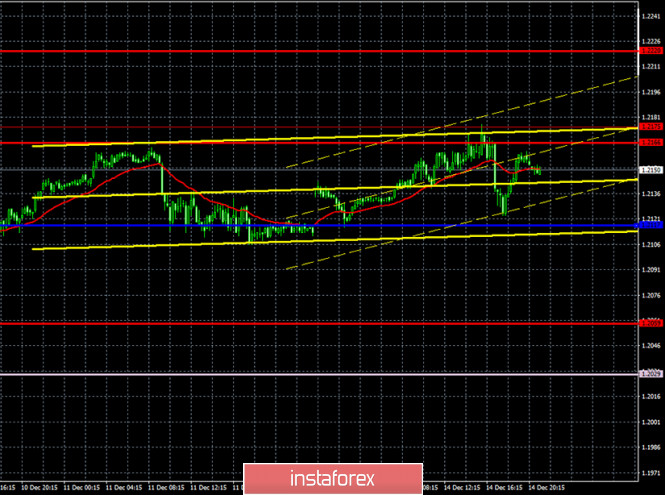
The higher linear regression channel is directed sideways on the 15-minute timeframe, while the lower one is directed upward, however, this is not important now, since they can change their direction very often in a flat, which does not mean a trend change on the hourly timeframe. And it is a flat on the hourly timeframe, so focus is on it.
EUR/USD 1H
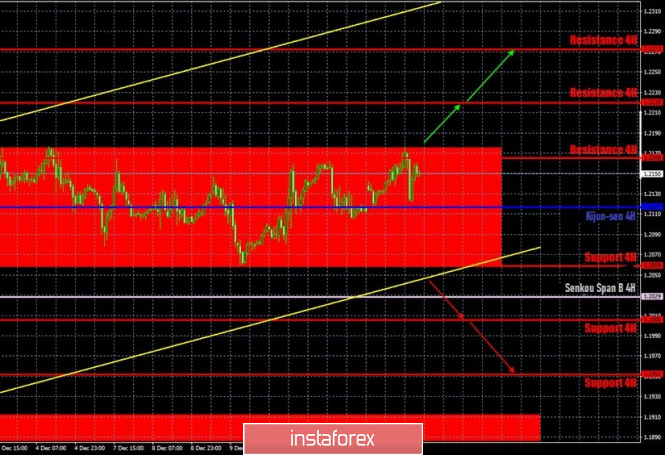
The euro/dollar pair continued to trade within the horizontal channel on the hourly timeframe of December 14, which is shown in the chart as a red rectangle. The pair's quotes have been within an approximately stop-point range for eleven days. Accordingly, the technical picture has not changed at all over the past trading day. The price perfectly reached the upper line of the horizontal channel at 1.2176 and rebounded off it in the same manner. As a result, a reversal of the downward movement began, which will probably continue to the lower line of the horizontal channel. At the same time, the bulls may try to push through the upper border of the channel, in which case the upward movement will resume. Recall that on the 4-hour timeframe, everything speaks in favor of continuing the upward movement. And the rising channel continues to be relevant on the hourly timeframe, within which the horizontal channel is located. The bears are still extremely weak and cannot even properly correct the euro/dollar pair. Not to mention form a downward trend.
COT report
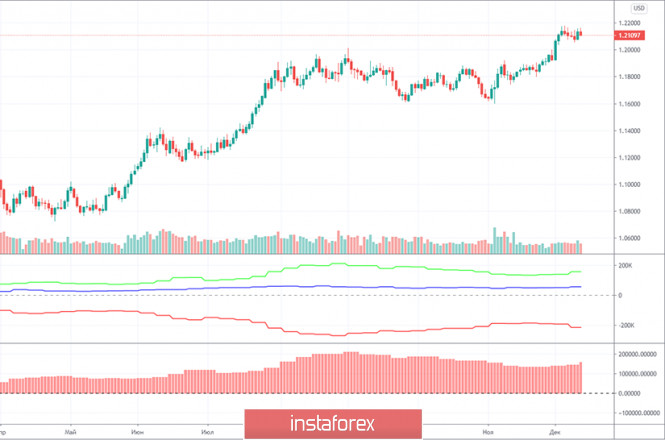
The EUR/USD pair increased by 180 points in the last reporting week (December 1-7), which is quite a lot for it. Well, the latest Commitment of Traders (COT) report for the same period showed an increase in net position among non-commercial traders for the third consecutive time. This means that professional market players are becoming more bullish again and are looking towards buying the euro. Although all they did was cut their long positions on the euro from the very beginning of September. But the fact remains. So far, instead of the end of the upward trend, we have seen it return, which, however, does not really change anything in the current situation. A group of non-commercial traders opened 12,736 Buy-contracts (longs) and closed 278 Sell-contracts (shorts) during the reporting week. Thus, the net position increased by 13,000. Both indicators began to show an increase again, which signals that the upward movement will continue. However, the green and red lines of the first indicator are still far enough from each other, which is a signal that the upward trend will end soon. The euro remains extremely overbought, its growth can best be described by the word speculative. Therefore, we are waiting for the upward trend to end. And in any case, you need to wait for technical signals.
The only report that was published on Monday was the EU's industrial production data. It turns out that this indicator increased on a monthly basis by 2.1% against the forecast of +2.0%. There is a slight difference, and the report itself is not very important, especially in conditions when traders ignore all macroeconomic reports. And there are no other news, reports, publications and important topics right now. It is relatively calm in the United States. There are, as they say, "football topics" that have no influence on the pair's movement and the mood of traders. By and large, America continues to prepare for the inauguration of Joe Biden, and at this time there is a process of transfer of power from the current US president to the future. Trump continues to challenge the election results, but he does so through social networks and the media, and not in the courts, which all as one dismissed his claims.
The US is set to publish its industrial product report on Tuesday. Most likely, the market reaction will be the same as the day before, which is non-existent. We cannot draw the attention of traders to any other important events, since there are no events right now. This week the Federal Reserve will meet in the United States. This is indeed an important event, but it is unlikely that major changes in monetary policy will be announced there. Most likely, the US central bank will limit itself to a cover letter and a speech by Fed Chairman Jerome Powell. None of the market participants expects that rates will be lowered or the quantitative incentive program to be expanded (it is already unlimited in size).
We have two trading ideas for December 15:
1) Buyers continue to own the initiative, despite the fact that the pair's quotes have been trading in a horizontal channel for a week and a half. However, this is a horizontal channel around 2.5-year highs. Therefore, you are advised to trade up while aiming for resistance levels 1.2220 and 1.2273 after surpassing its upper line. Take Profit in this case can range from 20 to 80 points. At this time, the pair's movement can be described as a flat.
2) Bears remain very weak at this time and cannot even correct the pair yet. We advise you to wait until we surpass the rising channel and the Senkou Span B line (1.2029). And only after that should you consider the possibility of opening sell-positions while aiming for support levels 1.2006 and 1.1952 and the support area of 1.1886-1.1912.
Forecast and trading signals for GBP/USD
Explanations for illustrations:
Support and Resistance Levels are the levels that serve as targets when buying or selling the pair. You can place Take Profit near these levels.
Kijun-sen and Senkou Span B lines are lines of the Ichimoku indicator transferred to the hourly timeframe from the 4-hour one.
Support and resistance areas are areas from which the price has repeatedly rebounded off.
Yellow lines are trend lines, trend channels and any other technical patterns.
Indicator 1 on the COT charts is the size of the net position of each category of traders.
Indicator 2 on the COT charts is the size of the net position for the "non-commercial" group.
The material has been provided by InstaForex Company - www.instaforex.com