
EUR/USD 15M
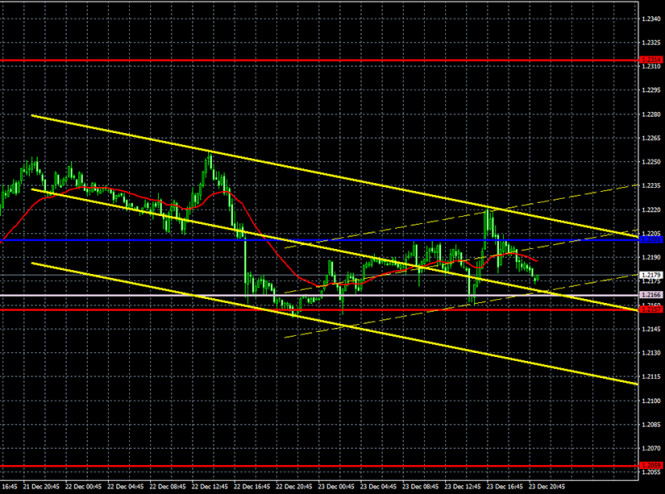
The lower linear regression channel has already turned up on the 15-minute timeframe, while the higher one is still pointing down. However, the narrowness of the lower channel eloquently indicates the weak volatility of the previous day. The same volatility might be present today. It is better to determine the trend on the hourly timeframe.
EUR/USD 1H
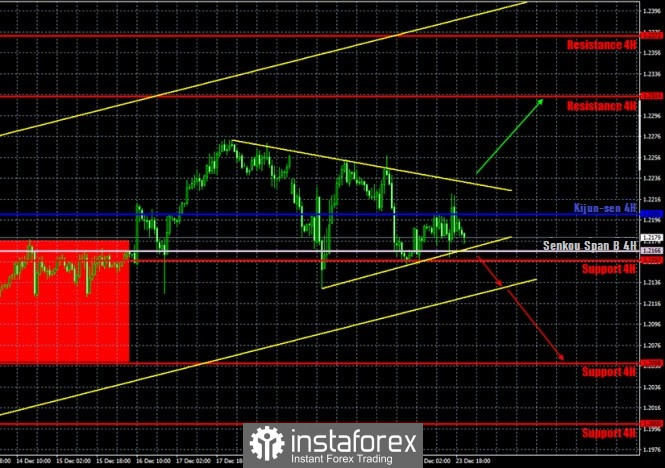
The EUR/USD pair was trading quite predictably on the hourly timeframe on Wednesday, December 23. An upward correction began after the price failed to overcome the Senkou Span B line and the support level of 1.2157, and so the pair corrected to the descending trend line throughout the day. However, an upward trend line was also created during the day, so now there is simply no pronounced trend. But traders have a sufficient number of different technical formations at their disposal. We remind you that the rising channel is still in force. So, globally, an upward trend is still present. However, the pair may continue to trade between the two trend lines during the day. On the one hand, overcoming any of them will provide a strong signal, but on the other hand, Christmas will be celebrated today and tomorrow, so most financial institutions will be closed. A certain number of traders can also leave the markets, and some can close part of their positions, which will lead to certain movements in the pair. In general, we do not expect high volatility. Therefore, if the pair does not significantly go beyond any trend line, then there will be no signal either.
COT report
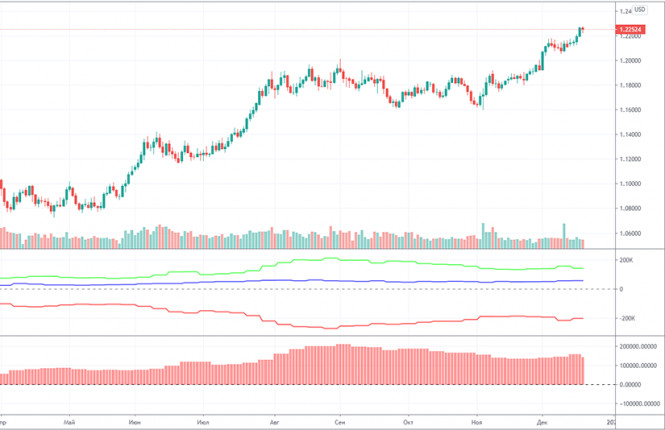
The EUR/USD pair increased by 30 points in the last reporting week (December 8-14). Recall that the last few weeks, the Commitment of Traders (COT) reports have shown an increase in net position among non-commercial traders. Simply put, professional players were becoming more bullish, although before that they had been preparing for a massive sell-off of the euro for several months. The non-commercial group closed 5,200 Buy-contracts (longs) and opened 10,800 Sell-contracts (shorts) in the last reporting week. That is, the net position decreased by 16,000, which is quite a lot. Professional players are looking towards selling the euro again. And if we take into account the long-term perspective, then non-commercial traders continue to lean towards selling the euro. This point is clear and understandable. The euro has been growing for a full nine months. All this time, it is extremely difficult for the dollar to even correct. Therefore, the euro is very much overbought. As for the indicators, they reflect the same decrease in the net position of non-commercial traders. The green line of the first indicator began to move again to meet the red line (net position of commercial traders), which is a signal of the end of the trend. Therefore, we are still expecting the upward movement to end for the euro, but at the same time we remind you that until there are no global technical signals about the end of the upward trend, you are not advised to trade down. There is no need to try to guess the downward reversal.
There was enough interesting news on Wednesday. Take, for example, data from overseas. The US durable goods order report, the report with the loudest signage, was the most boring. Most importantly, unemployment continues to decline in America, as evidenced by the rate of secondary applications for jobless benefits. We do not consider reports on personal income and expenses of Americans to be important, all other data were frankly secondary. Thus, over the past two days, we found out that the US GDP grew by 33.4% in the third quarter, while unemployment continues to decline. These macroeconomic factors, unfortunately, still do not provide much support to the dollar. The dollar continues to be around its 2.5-year lows against the euro.
No major events scheduled on Thursday for both the US and the EU. We have already said that Christmas will begin to be celebrated today, so the event calendars are completely empty. We do not expect global news either. Of course, Donald Trump may surprise you, he likes to do so, but it is also unlikely. He has already refused to sign a bill on the provision of assistance to the American economy, considering it "shameful". It is unlikely that he will be able to do anything more.
We have two trading ideas for December 24:
1) Buyers have temporarily released the pair from their hands, but the bears are not letting it go far down. The bearish mood remains while the price is below the trend line. Yesterday traders could have earned several dozen points upon a rebound signal from the Senkou Span B line. You are advised to open new longs if the price settles above the downward trend line, while aiming for the resistance level of 1.2314. Take Profit in this case can be up to 70 points.
2) Bears remain very weak at this time and have failed to fall below 1.2157. Therefore, you are advised to open short positions if the bears manage to overcome the upward trend line and the 1.2157 level. Targets - the lower line of the rising channel and the support level of 1.2058. Take Profit in this case can be up to 80 points.
Forecast and trading signals for GBP/USD
Explanations for illustrations:
Support and Resistance Levels are the levels that serve as targets when buying or selling the pair. You can place Take Profit near these levels.
Kijun-sen and Senkou Span B lines are lines of the Ichimoku indicator transferred to the hourly timeframe from the 4-hour one.
Support and resistance areas are areas from which the price has repeatedly rebounded off.
Yellow lines are trend lines, trend channels and any other technical patterns.
Indicator 1 on the COT charts is the size of the net position of each category of traders.
Indicator 2 on the COT charts is the size of the net position for the "non-commercial" group.
The material has been provided by InstaForex Company - www.instaforex.com