
Trend analysis (Fig. 1).
Today, the market will attempt to resume its upward movement from the level of 1.2950 (closing of yesterday's daily candle) in order to reach the pullback level of 50% - 1.3078 (blue dotted line). If this level is tested, work downward with the target of 1.3023, which is a pullback level of 14.6% (red dotted line).
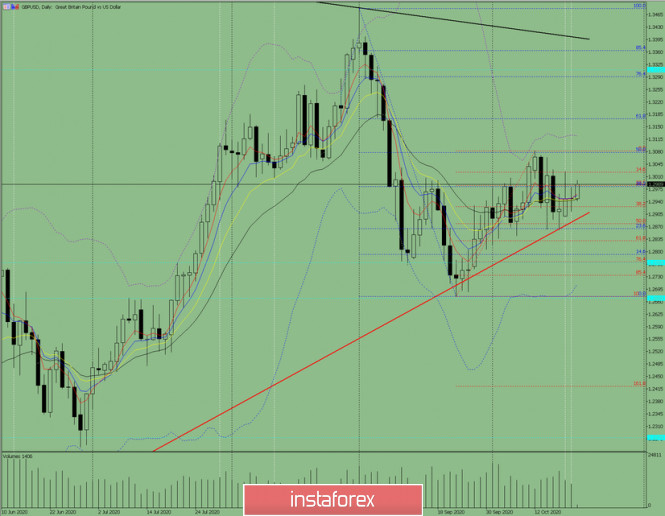
Figure 1 (Daily chart).
Complex analysis:
- Indicator analysis - up
- Fibonacci levels - up
- Volumes - up
- Candle analysis - up
- Trend analysis - down
- Bollinger bands - up
- Weekly chart - up
General conclusion:
Today, the price from the level of 1.2950 (closing of yesterday's daily candle) will attempt to continue moving up in order to reach the pullback level of 50% - 1.3078 (blue dotted line). If this level is tested, work downward to the target of 1.3023, which is a pullback level of 14.6% (red dotted line).
Alternative scenario: the price from the level of 1.2937 (closing of yesterday's daily candle) works up to reach the 50% pullback level - 1.3078 (blue dotted line). In case of testing this level, work up to the target of 1.3173, which is a retracement level of 61.8% (blue dotted line).
The material has been provided by InstaForex Company - www.instaforex.com