
Trend analysis (Fig. 1).
Today, from the level of 1.1824 (the closing of yesterday's daily candle), the market can continue to move up with the goal of 1.1860 which is a pullback level of 61.8% (red dotted line). If this level is tested, further work up with the goal of 1.1912 which is the historical resistance level (blue dotted line). From this level, you can work downwards.
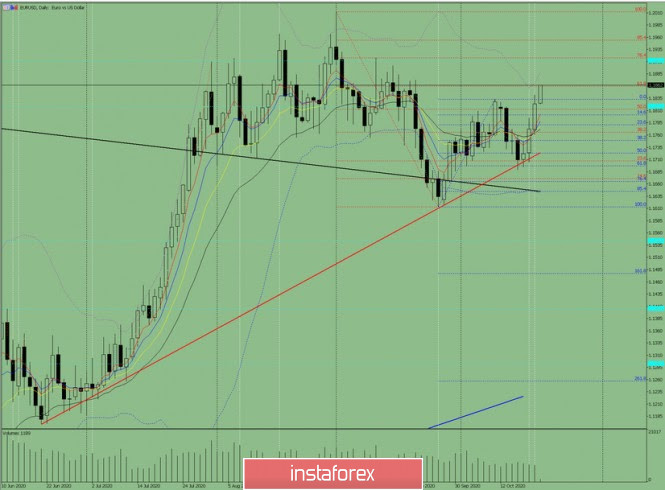
Figure 1 (daily chart).
Complex Analysis:
- indicator Analysis – up
- Fibonacci Levels – up
- Volumes – up
- Technical Analysis – down
- Trend Analysis – up
- Bollinger Bands – up
- Weekly Chart - the up
General conclusion:
today the price may continue to move up with the target of 1.1860 which is a pullback level of 61.8% (red dotted line). If this level is tested, further work up with the goal of 1.1912 which is the historical resistance level (blue dotted line).
Alternative scenario: when moving up and reaching the pullback level of 61.8% - 1.1860 (red dotted line), the price may start moving down to the historical support level - 1.1819 (blue dotted line).
The material has been provided by InstaForex Company - www.instaforex.com