
To open long positions on GBP/USD, you need:
After several unsuccessful attempts to pull down the pound below support at 1.2819 in the first half of the day, buyers of the pound took the initiative and created a good signal to enter long positions. Let's figure it out. On the 5-minute chart, you can see how the bulls achieved a false breakout after failing to test support at 1.2819, and then they started to actively buy the pound. The bears tried to defend the resistance area of 1.2869, but the correction from there was no more than 25 points, afterwards there was a breakthrough of this range and GBP/USD sharply grew to a high of 1.2925, from where it was necessary to sell the pound immediately on a rebound, which brought about 30 points of profit. Unfortunately, we could not wait for the quote to return and test the 1.2869 level after its breakout, so I missed the movement from 1.2869 to 1.2925.
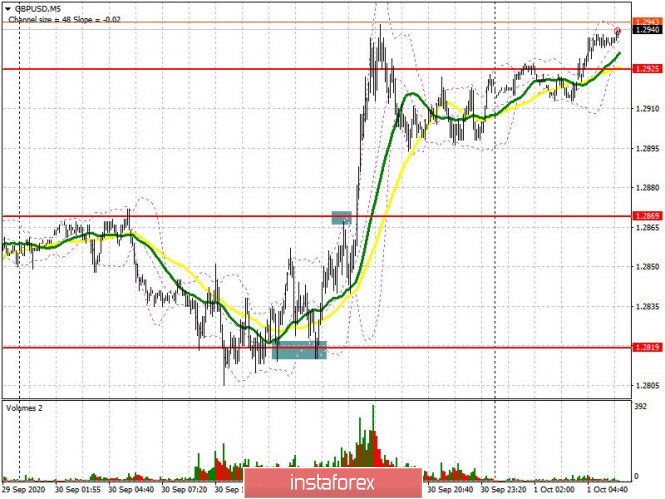
At the moment, the situation in the pair is rather delicate. The 1.2925 level has been repeatedly smeared. Forming a false breakout on it in the first half of the day and returning to this area will be a good signal to buy the pound in order to continue the upward trend so the quote will rise towards the high of 1.2995, which is where I recommend taking profits. The 1.3089 area is a distant goal, and we can only reach it with good news on Brexit. In case GBP/USD falls, you can also look at long positions after testing 1.2869, which is where the moving averages pass, playing on the side of buyers. It is possible to buy the pound immediately on a rebound from a larger low of 1.2819, counting on a correction of 30-40 points within the day. The lower border of the new ascending channel is also located there.
The Commitment of Traders (COT) reports for September 22 did not record significant changes in the market, as everyone took a wait-and-see attitude and are watching how the economy will react to the next phase of growth in the incidence of COVID-19 and how the situation will develop further. Brexit. Most likely, the pressure on the pound will gradually return as the second wave of coronavirus spreads and the negotiations on a trade deal between the UK and the EU become more complicated, where there is not even a hint of a compromise between the parties. Short non-commercial positions slightly decreased from 41,508 to 40,523 during the reporting week. Long non-commercial positions also decreased from 43,801 to 43,487. As a result, the non-commercial net position remained practically unchanged at 2,964 against 2,293 weeks earlier.
To open short positions on GBP/USD, you need:
Pound sellers have a very simple task. In order to return the market over to their side, it is necessary to pull down GBP/USD below 1.2925 and test it from the bottom up, which forms a good entry point for short positions. The initial goal will be to update support at 1.2869, which coincides with the moving averages and acts as the middle of the horizontal channel. Consolidating below this range will cause the pound to fall to the week's low in the area of 1.2819, which is where I recommend taking profits. In case the pair grows further, it is best not to rush to sell, but to wait until a high of 1.2995 has been updated, from where you can sell the pound immediately on a rebound based on a 30-40 point correction within the day. A more powerful resistance level, in case bears are not active at 1.2995, is located near the 31st figure - at 1.3089.
Indicator signals:
Moving averages
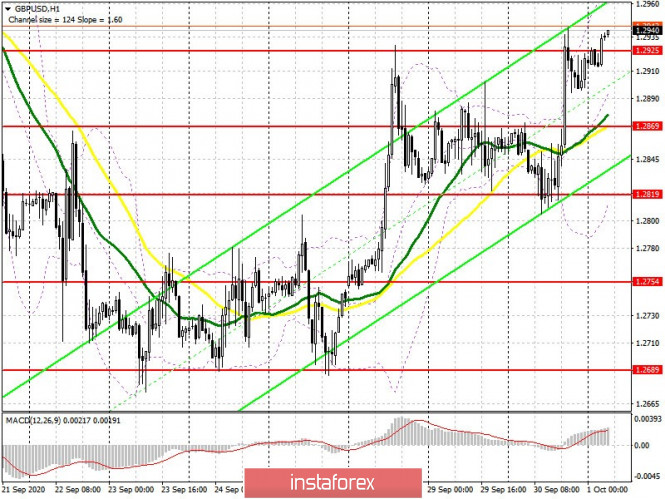
Trading is carried out above 30 and 50 moving averages, which indicates that the upward correction will continue for the pair.
Note: The period and prices of moving averages are considered by the author on the H1 hourly chart and differs from the general definition of the classic daily moving averages on the D1 daily chart.
Bollinger Bands
A breakout of the upper border of the indicator in the 1.2970 area will lead to a new wave of growth for the pound. In case the pair falls, support will be provided by the lower border of the indicator in the 1.2820 area.
Description of indicators
- Moving average (moving average, determines the current trend by smoothing out volatility and noise). Period 50. It is marked in yellow on the chart.
- Moving average (moving average, determines the current trend by smoothing out volatility and noise). Period 30. It is marked in green on the chart.
- MACD indicator (Moving Average Convergence/Divergence — convergence/divergence of moving averages) Quick EMA period 12. Slow EMA period to 26. SMA period 9
- Bollinger Bands (Bollinger Bands). Period 20
- Non-commercial speculative traders, such as individual traders, hedge funds, and large institutions that use the futures market for speculative purposes and meet certain requirements.
- Long non-commercial positions represent the total long open position of non-commercial traders.
- Short non-commercial positions represent the total short open position of non-commercial traders.
- Total non-commercial net position is the difference between short and long positions of non-commercial traders.