
Overview :
- Pair : USD/JPY (US dollar/Japanese yen).
- Expertise : Technical analysis.
- Average time frame of trades : 1 day to 2 days.
- Trend : Sideways channel.
- Forecast : Bullish scenario.
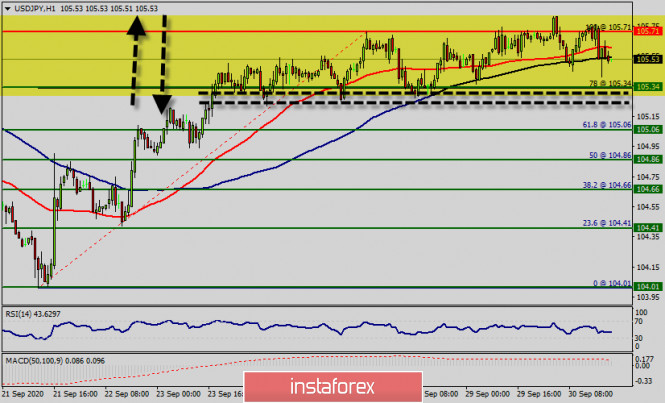
It is looking at a standard chart pattern. Buyers are trying to form a Likely bullish secondary higher top inside the minor retracement zone (105.34), while the chart shows that the trend of USD/JPY pair movement was controversial as it took place in a narrow sideways channel.
The market showed signs of instability at the area of 105.34 - 105.71 . Amid the previous events, the price is still moving between the levels of 105.34 and 105.71.
The first resistance level sets at the price of 105.71. 1. So, above the price of 105.71 will indicate the buying is getting stronger with potential upside targets coming in at the level of 105.98.
But before opening any long buying position, it is recommended to be cautious while placing orders in this area (105.34 and 105.71). Hence, we need to wait until the sideways channel has completed.
We foresee the current rise will remain within a framework of correction. However, if the pair fails to pass through the level of 105.71, the market will indicate a bearish opportunity below the strong resistance level of 105.71 (the level of 105.71 coincides with the double top too).
The level of 105.71 will act as strong resistance and the double top has already set at the point of 105.71 .
Since there is nothing new in this market, it is not bearish yet. Buy deals are recommended above the first support at the level of 105.34 with the first target at 105.71.
If the trend breaks the resistance level of 105.71, the pair is likely to move upwards continuing the development of a bullish trend to the level 105.95 in order to test the daily resistance 2.
From this point, the pair is likely to begin an ascending movement to the point of 105.95 and further to the level of 106.25.
Otherwise, if a breakout happens at the support level of 105.06, then this scenario may become invalidated.
Indicators :
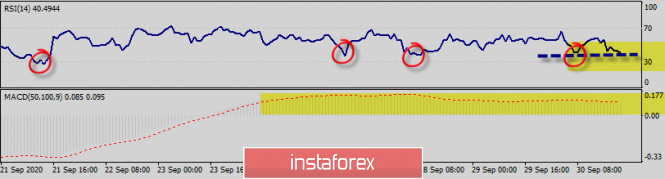
- RSI (14) is seeing major support above 40 where we expect further upside movement from.
- MACD (50, 100, 9) is seeing major resistance and a bearish divergence vs price also signals that a reversal is impending because of the saturation condition.
Trading recommendations:
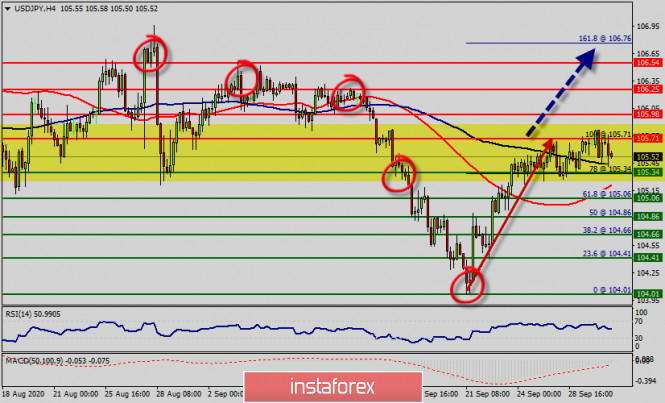
- On the four hour chart :
- According to previous trades, the USD/JPY pair has still been trapping between 105.06 and 105.95.
- Buy above 105.06 with target at 105.71, 105.95 then 106.25.
- Below 105.00 look for further downside with the first target of 104.66, then 104.01.
Trading tips :
- R3 and S3 are considered as clear indicators of the maximum range of extreme volatility though it is possible to pass them through.
- In case of the breaking news release that may affect the market, the price is likely to go straight through R1 or S1 and even reach R2 and R3 or S2 and S3.
Major levels :
- Resistance 3 : 106.25
- Resistance 2 : 105.98
- Resistance 1 : 105.71
- Pivot Point : 105.34
- Support 1 : 105.06
- Support 2 : 104.66
- Support 3 : 104.01