
To open long positions on EUR/USD, you need:
The bears did an excellent job yesterday and went beyond the area below a very large support level, while good US inflation data and a very sharp decline in business sentiment in the eurozone countries only strengthened the demand for the US dollar.
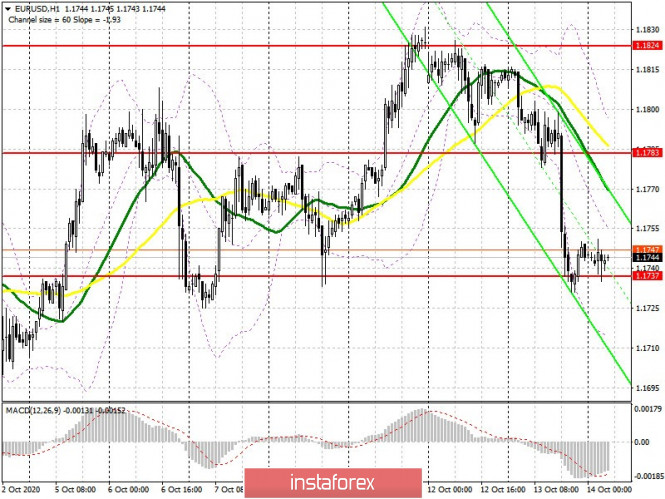
The bulls' task for the first half of the day is to prevent a breakout of support at 1.1737, the area where the euro stopped falling yesterday. Forming a false breakout there will be a signal to buy EUR/USD. An additional moment, which will confirm that buyers have returned to the market, is when divergence has formed on the MACD indicator after yesterday's low has been updated. In such a scenario, the buyer should return the euro to the resistance area of 1.1783, where the moving averages are, which is now playing on the side of the sellers. Getting the price to settle at this level will return the market to a bullish position and also lead to updating the weekly high around 1.1824, where I recommend taking profits. In case bulls are not active in the 1.1737 area in the morning, I recommend abandoning long positions until support at 1.1688 has been updated, from which you can buy EUR/USD immediately on a rebound, counting on a correction of 20-30 points within the day. Since we do not expect today's eurozone industrial production data to bring great news, it is best to buy the euro as low as possible from much larger lows.
The Commitment of Traders (COT) report for October 6 showed a reduction in long positions and an increase in short positions, which led to an even greater decrease in the delta. Buyers of risky assets believe in sustaining the bull market, but prefer to proceed with caution, as there is no good news about the eurozone and the pace of economic recovery so far. Thus, long non-commercial positions decreased from 241,967 to 231,369, while short non-commercial positions increased from 53,851 to 57,061. The total non-commercial net position decreased to 174,308, against 188,116 a week earlier. which indicates a wait-and-see attitude of new players. However, bullish sentiments for the euro remain rather high in the medium term.
To open short positions on EUR/USD, you need:
Bears are in control of the market and are set to break support at 1.1737. Most likely, we will still see a downward momentum from the pair, therefore, forming a breakout and settling below 1.1737 along with testing this level from the bottom up forms a good entry point to sell while aiming for the price to fall towards a low of 1.1688. A more distant task for the bears is to update support at 1.1644 at the end of the week, where I recommend taking profits. In case a divergence forms on the MACD indicator and sellers are not active at the 1.1737 level, it is best to postpone short positions until a larger resistance at 1.1783 has been updated, where the upper border of the new descending price channel also passes. It is also possible to sell the euro immediately on a rebound from the week's high in the 1.1824 area with the goal of correcting by 20-30 points within the day.
Indicator signals:
Moving averages
Trading is conducted below 30 and 50 moving averages, which indicates a shift in market sentiment in favor of sellers.
Note: The period and prices of moving averages are considered by the author on the H1 hourly chart and differs from the general definition of the classic daily moving averages on the D1 daily chart.
Bollinger Bands
If the pair grows, the movement will be limited by the upper border of the indicator around 1.1790. The first test of the lower border of the indicator in the 1.1715 area may limit the pressure on the euro, but its break will lead to a larger sale.
Description of indicators
- Moving average (moving average, determines the current trend by smoothing out volatility and noise). Period 50. It is marked in yellow on the chart.
- Moving average (moving average, determines the current trend by smoothing out volatility and noise). Period 30. It is marked in green on the chart.
- MACD indicator (Moving Average Convergence/Divergence — convergence/divergence of moving averages) Quick EMA period 12. Slow EMA period to 26. SMA period 9
- Bollinger Bands (Bollinger Bands). Period 20
- Non-commercial speculative traders, such as individual traders, hedge funds, and large institutions that use the futures market for speculative purposes and meet certain requirements.
- Long non-commercial positions represent the total long open position of non-commercial traders.
- Short non-commercial positions represent the total short open position of non-commercial traders.
- Total non-commercial net position is the difference between short and long positions of non-commercial traders.