
Hourly chart of the EUR/USD pair
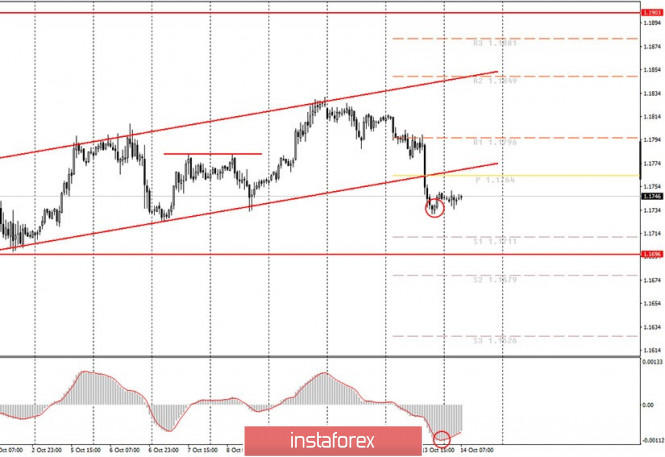
The EUR/USD pair began a weak round of corrective movement last night after it fell by 100 points the day before. Unfortunately, the current size of the correction is not enough to call it a correction in principle, as well as for the MACD indicator to be sufficiently discharged. The indicator is still at its lowest positions, so it will be extremely difficult for it to generate sell signals. This is the specificity of this indicator. Therefore, like last night, we advise beginners to continue waiting for an upward correction to develop and move upward by at least 40-50 points. Not only will such a movement allow us to expect new sell signals, but also a trend line. As for the long-term prospects for the pair's movement, we should not expect it to fall below the $1.16 level in the coming weeks. The problem is that the US dollar has hardly been in demand in recent months. And now - even more so, since the presidential elections in the United States are approaching, and elections are always uncertain. At least in democratic countries. Thus, traders can expect it to fall by another 100-120 points.
The fundamental background for the EUR/USD pair remains the same. All the same factors that worked in recent weeks continue to work today. If you look at the higher timeframes (daily, for example), it is obvious that the pair has been trading in a narrow horizontal channel in recent months, no more than 300 points wide. However, we identified a horizontal channel of $1.17-1.19 by even studying the hourly timeframe, which lasted for a long time. European Central Bank President Christine Lagarde is set to deliver another speech in the European Union on Wednesday. However, Lagarde has recently been indulging the markets with her regular speeches, so one should hardly expect any fundamentally new information from her. Moreover, in her last speech, Lagarde considered the possibilities and benefits of creating a digital euro and did not touch on the issues of monetary policy, the economy and the pandemic. Thus, from the point of view of the fundamental background, it is difficult to explain why quotes fell yesterday, and today it is impossible to predict anything.
Possible scenarios for October 14:
1) Buy positions on the EUR/USD pair have ceased to be relevant at the moment, since the pair has left the ascending channel and will now form a new downward trend. Thus, in order to consider new long positions, one should wait until new technical patterns appear, such as trend lines or channels, which would support the upward movement.
2) Sell positions have become relevant at the moment. However, following the results of the last few days, the EUR/USD pair lost 100 points in total. Therefore, now we still advise you to wait for an upward correction, as the MACD indicator needs to be discharged after sharply falling to the zero level. At the time of this writing, the price has not gone up enough, therefore, we expect the quotes to grow during the day. You should only open short positions on 1.1711 and 1.1679 after this growth and when the MACD indicator has reversed to the downside.
On the chart:
Support and Resistance Levels are the Levels that serve as targets when buying or selling the pair. You can place Take Profit near these levels.
Red lines are the channels or trend lines that display the current trend and show in which direction it is better to trade now.
Up/down arrows show where you should sell or buy after reaching or breaking through particular levels.
The MACD indicator (14,22,3) consists of a histogram and a signal line. When they cross, this is a signal to enter the market. It is recommended to use this indicator in combination with trend lines (channels and trend lines).
Important announcements and economic reports that you can always find in the news calendar can seriously influence the trajectory of a currency pair. Therefore, at the time of their release, we recommended trading as carefully as possible or exit the market in order to avoid a sharp price reversal.
Beginners on Forex should remember that not every single trade has to be profitable. The development of a clear strategy and money management are the key to success in trading over a long period of time.
The material has been provided by InstaForex Company - www.instaforex.com