
EUR/USD 1H
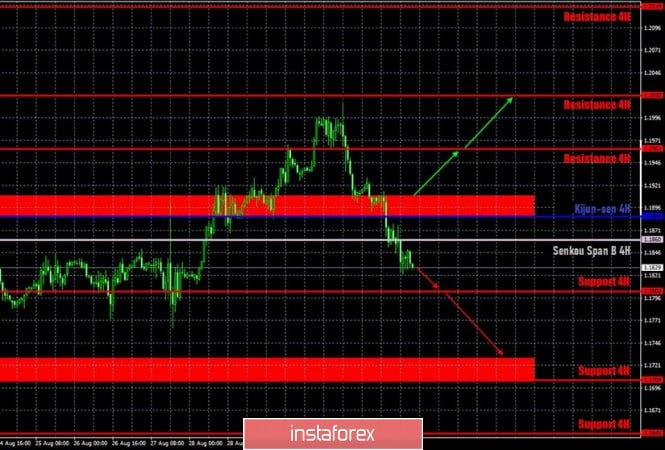
The euro/dollar pair calmly crossed the support area of 1.1886-1.1910, then the Kijun-sen and Senkou Span B lines on the hourly timeframe on September 2. Thus, the bears were finally active and can now take the pair back to two-month lows located near the $1.17 level. It is still difficult to say whether the US dollar will be able to continue strengthening below this level. Considering the fundamental background that continues to come from overseas. However, as we have said more than once, no currency can rise in price forever, and a correction has been brewing for the euro for more than a month. And not a 200-point downward correction, but at least by 300-400 points, since the total upward movement over the past three months is 1200 points. Thus, at this time, we expect the quotes to decline to $1.17.
EUR/USD 15M
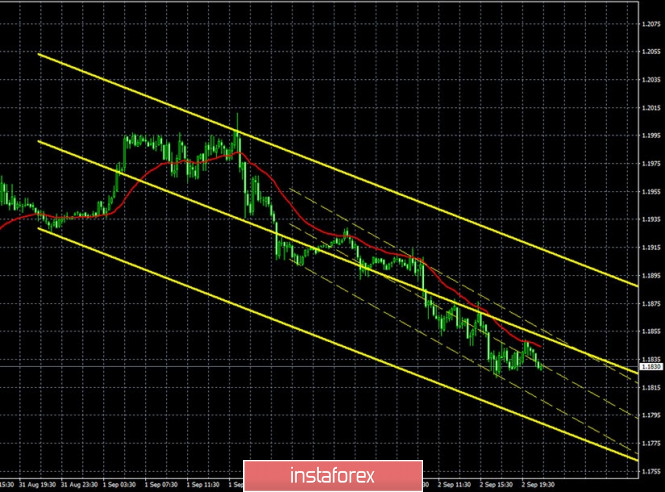
Both linear regression channels turned down on the 15-minute timeframe, thereby signaling a downward trend. A new Commitments of Traders (COT) report was released last Friday. Take note that its character has not changed at all compared to previous COT reports. Despite the fact that the euro/dollar has been trading within the side channel for more than a month, professional traders continue to increase their net position. In other words, the number of Buy-contracts is growing for non-commercial traders (the most important group of traders), while the number of Sell-contracts is decreasing. The non-commercial category of traders opened 1,302 Buy-contracts and closed 11,310 sell contracts during the reporting week on August 19-25. Thus, the net position (the difference between the number of buy and sell contracts) increased by 12,000. Therefore, we can draw the same conclusions as a week ago and two weeks ago: professional traders continue to view the euro as a more attractive currency to invest than the US dollar. The euro continued to steadily grow during the last five trading days (August 26 - September 1), which will be included in the next COT report. The fall started on the evening of September 1, thus, it is unlikely that the new report will reflect the euro's fall. Moreover, as before, so far the euro's fall is not too strong. All the same notorious 200 points.
The only report that was released in the eurozone on Wednesday, September 2 was data on retail sales in Germany, which showed a decrease in July by 0.9% m/m. However, US data were no better - the ADP report on changes in the number of employees in the private sector showed an increase of only 428,000, while forecasts predicted an increase of 950,000. A month earlier, this report also turned out to be significantly weaker than expert forecasts. Thus, the US data could have hardly triggered the dollar's rise. Meanwhile, some case studies show that US President Donald Trump is closing the lead over his main opponent in the presidential election, Joe Biden. At the moment, USA Today reports Biden's 7% gap from Trump. Earlier, many publications and opinion polls showed a gap of at least 12%. However, in total, about 1,000 Americans were interviewed, which is very small for such conclusions. The error of the results can be 5-10%. Thus, in reality, Biden's lead of 10-12% may remain.
Based on the above, we have two trading ideas for September 3:
1) Bulls continue to take profits after reaching the 1.2000 level. Since the price has settled below the Kijun-sen and Senkou Span B lines, which are the two strongest lines of the Ichimoku indicator, it is not recommended to open long deals at this time. Bulls can become active again above the 1.1886-1.1910 area. In this case, long positions will be relevant with targets at the resistance levels of 1.1961 and 1.2020. Take Profit in this case will be from 30 to 90 points.
2) Bears got a new opportunity to start forming a new downward trend, as they managed to gain a foothold below the Senkou Span B line (1.1860). Thus, we recommend staying in short positions with targets at the 1.1803 level and the support area of 1.1705-1.1728 as long as the price is below the Senkou Span B line. The potential Take Profit in this case is 20 to 90 points... An upward correction is possible after the quotes fall by almost 200 points.
Explanations for illustrations:
Support and Resistance Levels are the levels that serve as targets when buying or selling the pair. You can place Take Profit near these levels.
Kijun-sen and Senkou Span B lines are lines of the Ichimoku indicator transferred to the hourly timeframe from the 4-hour one.
Support and resistance areas are areas from which the price has repeatedly rebounded off.
Yellow lines are trend lines, trend channels and any other technical patterns.
The material has been provided by InstaForex Company - www.instaforex.com