
To open long positions on GBP/USD, you need to:
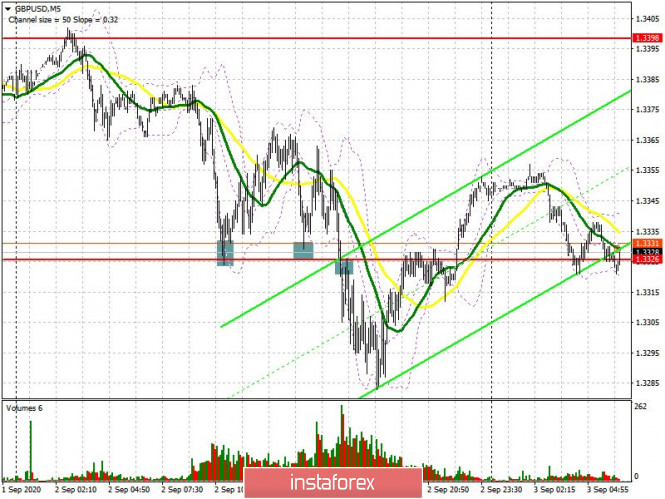
A rather interesting signal to sell the British pound was formed yesterday, since long deals failed due to the fact that we just missed a level. In general, the pressure on the pound has remained, and the resulting technical head-and-shoulders reversal pattern may result in a larger decline for the pair. But let's deal with yesterday's trade. Missing long deals from the 1.3326 level was very obvious, but those who were more attentive and have read my afternoon review were waiting for a breakout and a chance to settle under this level, which happened. Testing the 1.3326 area from top to bottom formed an excellent entry point into short positions, which brought about 45 points of profit. At the moment, a very important task for bulls is to protect the support of 1.3315, where a false breakout is a signal to open long positions while counting on a return and a chance to settle above the resistance of 1.3378. Afterwards, you can add long deals on the pound and wait until this week's high has been updated at 1.3467, which is where I recommend taking profits. In case the pound falls in the long term, and everything will depend on the PMI data for the UK services sector, it is best to consider new long positions after the support test of 1.3243 or buy GBP/USD for a rebound from the low of 1.3165 based on a correction of 30-40 points within the day.
Let me remind you that the Commitment of Traders (COT) reports for August 25 recorded a reduction in long positions, as well as a reduction in short positions. This suggests that players are leaving the market who want to lock in profits at current highs in anticipation of very strong market fluctuations in the future. The COT report indicates that there was a reduction in short non-commercial positions from the level of 47,806 to the level of 39,790 during the week. Long non-commercial positions declined more significantly from 54,310 to 45,390. As a result, the non-commercial net position also fell slightly, but remained in positive territory and reached 5,600 against 6,504 a week earlier.
To open short positions on GBP/USD, you need to:
The main task of the bears is to implement the head and shoulders technical pattern, which will bring about a breakout and a chance to settle below the support of 1.3315, thereby leading the pound to sharply fall to the support area of 1.3243, and afterwards, an update of 1.3165, which is where I recommend taking profits. However, this scenario can only be implemented with weak PMI data for the UK services sector. Bank of England Governor Andrew Bailey will also deliver another speech today. In case the pound grows, it is best not to rush to open short positions, but to wait until a false breakout forms in the resistance area of 1.3378. I recommend selling GBP/USD immediately for a rebound only after when the high of 1.3467 has been updated, based on a correction of 30-40 points within the day.
Indicator signals:
Moving averages
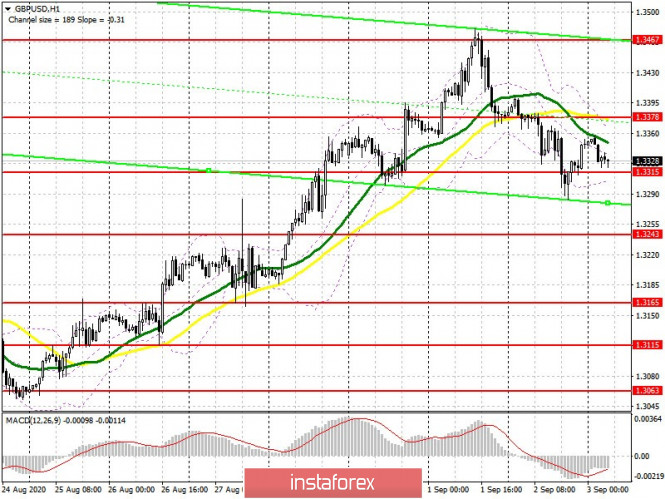
Trading is carried out just below the 30 and 50 moving averages, which indicates continued pressure on the British pound.
Note: The period and prices of moving averages are considered by the author on the H1 hourly chart and differs from the general definition of the classic daily moving averages on the D1 daily chart.
Bollinger Bands
A breakout of the lower border of the indicator in the 1.3310 area will lead to selling the pound. A breakout of the upper border of the indicator in the area of 1.3375 may lead to a new wave of growth for the pair.
Description of indicators
- Moving average (moving average, determines the current trend by smoothing out volatility and noise). Period 50. It is marked in yellow on the chart.
- Moving average (moving average, determines the current trend by smoothing out volatility and noise). Period 30. It is marked in green on the chart.
- MACD indicator (Moving Average Convergence/Divergence — convergence/divergence of moving averages). Fast EMA period 12. Slow EMA period to 26. The 9 period SMA.
- Bollinger Bands (Bollinger Bands). The period 20.
- Non-commercial speculative traders, such as individual traders, hedge funds, and large institutions that use the futures market for speculative purposes and meet certain requirements.
- Long non-commercial positions represent the total long open position of non-commercial traders.
- Short non-commercial positions represent the total short open position of non-commercial traders.
- Total non-commercial net position is the difference between the short and long positions of non-commercial traders.