
EUR/USD 1H
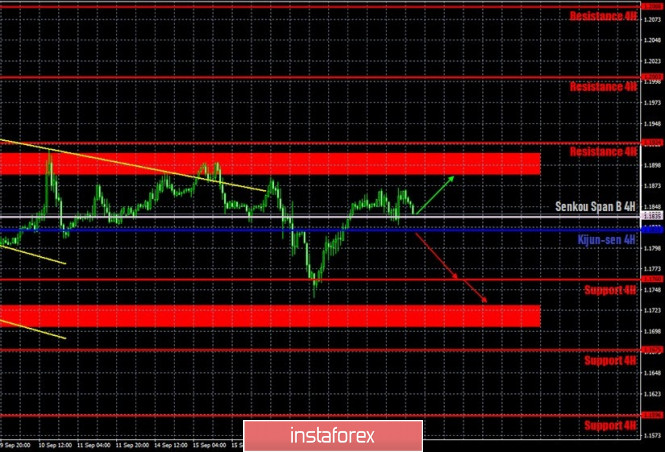
The EUR/USD pair was indistinctly trading on the hourly timeframe on Friday, September 18. If the pair traded ambiguously earlier because it proceeded in a narrow price range (1.17-1.19), then on Friday it was trading indistinctly because it was in an even more narrow price range, only about 50 points... Thus, market participants simply left ahead of schedule for the weekend. The pair crossed the Senkou Span B line at the end of the trading week, which is irrelevant at this time. All the lines of the Ichimoku indicator, although they remain relatively strong, nevertheless, do not signal a trend in the flat or even when prices rebound from them. Therefore, formally, you can expect to move to the resistance area of 1.1884-1.1910, but the probability of this is 50/50. Just like the probability of moving down to the support area of 1.1704-1.1728.
EUR/USD 15M
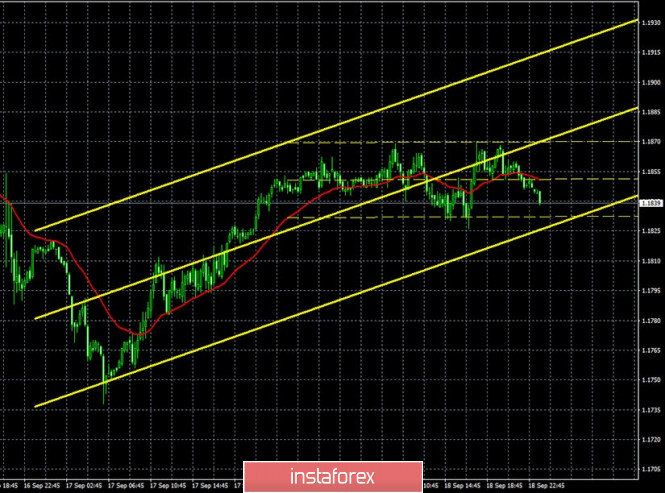
The higher linear regression channel turned to the upside on the 15-minute timeframe, and the lower one moved down, which implies that the pair might start moving down on the hourly timeframe. The EUR/USD pair continued to trade in the 1.17-1.19 horizontal channel last week. Thus, even if there were changes in the mood of large traders, it did not show on the pair's chart. And there were changes. Non-commercial traders closed as many as 17,000 Buy-contracts (longs) and only 1,500 Sell-contracts (shorts) during the reporting week (September 9-15). Thus, the sentiment of the most important group of traders, "non-commercial", has changed towards a bearish one. The net position for this group of traders also decreased by 15,000 contracts. And this, in turn, means that professional traders began to look towards buying the US dollar and selling the euro. Commercial traders also actively closed both types of contracts. However, we are less interested in this group. There are still no results of all these changes. And from September 16 to this day, the EUR/USD pair's movements still does not provide reasons to assume that they will appear in the near future. Thus, the changes reflected in the COT report do not coincide with what is currently happening in the foreign exchange market.
Not a single important macroeconomic report in the European Union on Friday, just an insignificant consumer confidence index from the University of Michigan in the United States. Therefore, it is easy to explain why volatility was low and trading was absolutely calm. There was no other news of a general nature either. Thus, traders can only wait for news and new macroeconomic data. The macroeconomic events calendar is completely blank on Monday. Federal Reserve Chairman Jerome Powell may deliver a speech, but not all news calendars contain this event. With a high degree of probability, the day will be absolutely empty and, most likely, absolutely indistinct trading with low volatility will continue.
We have two trading ideas for September 18:
1) Buyers could not break through several resistances near the upper line of the $1.17-1.19 horizontal channel. Therefore, we advise you to consider long positions once the 1.1884-1.1910 area has been overcome, and then you can aim for the resistance level at 1.2003. Take Profit in this case will be about 60 points.
2) Bears, with grief, pulled down the pair in half to the lower area of the horizontal channel (1.17-1.19), but also did not stay there for a long time. The upward movement resumed, so now the bears need to wait until they consolidate the price below the Kijun-sen line (1.1819) in order to open short positions while aiming for the support level at 1.1760. The potential Take Profit in this case is about 45 points. We remind you that the pair's current movements are absolutely indistinct and most closely corresponds to the meaning of the word flat.
Explanations for illustrations:
Support and Resistance Levels are the levels that serve as targets when buying or selling the pair. You can place Take Profit near these levels.
Kijun-sen and Senkou Span B lines are lines of the Ichimoku indicator transferred to the hourly timeframe from the 4-hour one.
Support and resistance areas are areas from which the price has repeatedly rebounded off.
Yellow lines are trend lines, trend channels and any other technical patterns.
The material has been provided by InstaForex Company - www.instaforex.com