
To open long positions in GBP/USD, you need:
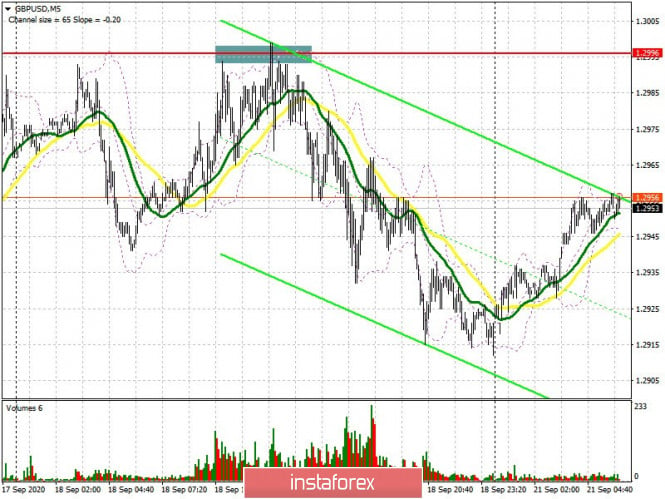
A fairly good signal to sell the British pound appeared last Friday, which caused the pair to fall by 50 points. Let's take a look at the 5-minute chart and break down the trade. In my review, I recommended opening short positions after forming a false breakout at 1.2996, which happened. We see how the bears won't allow the pair to go above 1.2996, and all other attempts to raise GBP/USD do not even reach this range, as a result of which the bulls gave up and the pound fell. However, the pair only reached the middle of the horizontal channel, where trade is now being conducted.
Important changes took place in the futures market after the pound significantly fell. The Commitment of Traders (COT) reports for September 15 recorded a reduction in long positions, and a large increase in short positions, which indicates the market's expectations and a high likelihood of the pound's fall in the long term, which is probably caused by uncertainty regarding the Brexit trade deal. And if last week it was possible to say that the downward momentum may start to gradually slow down, which the market showed us, now the situation is on the side of the pound sellers and the pair might continue to decline. Short non-commercial positions increased from 33,860 to 41,508 during the reporting week. Meanwhile, long non-commercial positions decreased from 46,590 to 43,801. As a result, the non-commercial net position sharply fell to 2,293, against 12 730 a week earlier.
As for the current market situation, I do not recommend rushing to buy or sell, since trading is carried out in the middle of the channel, and it is difficult to say where it would move in the short term. Buyers will still focus on the resistance level of 1.2996, settling above this range forms a good entry point into long positions in hopes of continuing the bull market and also updating the 1.3089 high, which is where I recommend taking profits. Persistent bulls will wait for a test of the 1.3178 area, but this is more like a dream, since such a movement requires positive Brexit news. In case the pair falls in the first half of the day, you can count on long positions from the support of 1.2867 based on a correction of 30-40 points within the day. If there is no activity in this range, and its breakout will revives the large bearish trend for the pound, then it is best to buy on a rebound from the 1.2777 low.
To open short positions on GBP/USD, you need:
Pound sellers need to do everything to prevent the pound from going beyond last week's high, otherwise, they will completely lose control over the market. Therefore, in case GBP/USD grows, forming the next false breakout at the 1.2996 level will be a signal to open short positions in the hopes of pulling down the pair to the support area of 1.2867, which is where I recommend taking profits. Resilient sellers will still be looking for a breakout and consolidation below this range, pulling down the pair towards the monthly low in the 1.2777 area. Testing this level will mark the beginning of a new downward trend for the pair. In case GBP/USD grows above the 1.2996 level in the first half of the day, I recommend postponing short positions and waiting until the 1.3089 high has been updated, afterwards you can sell the pound immediately on a rebound, counting on a 30-40 point correction within the day.
Indicator signals:
Moving averages
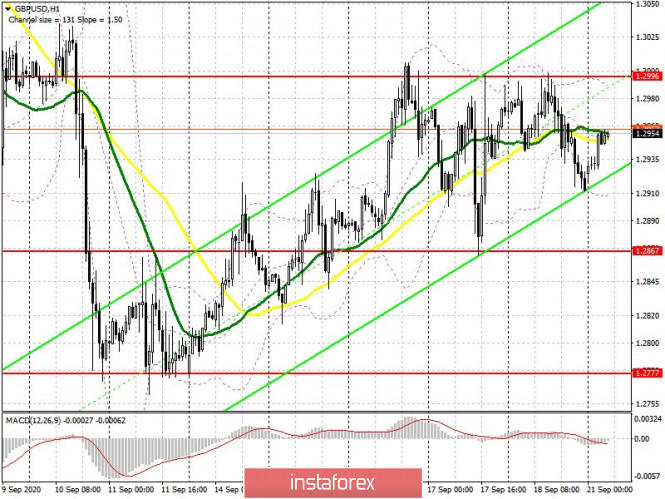
Trading is carried out in the area of 30 and 50 moving averages, which indicates uncertainty regarding direction in the short term.
Note: The period and prices of moving averages are considered by the author on the H1 hourly chart and differs from the general definition of the classic daily moving averages on the D1 daily chart.
Bollinger Bands
A breakout of the lower border of the indicator in the 1.2905 area will lead to a new wave of fall for the British pound. A breakout of the upper border in the 1.2985 area will lead to an upward correction of the pair.
Description of indicators
- Moving average (moving average, determines the current trend by smoothing out volatility and noise). Period 50. It is marked in yellow on the chart.
- Moving average (moving average, determines the current trend by smoothing out volatility and noise). Period 30. It is marked in green on the chart.
- MACD indicator (Moving Average Convergence/Divergence — convergence/divergence of moving averages) Quick EMA period 12. Slow EMA period to 26. SMA period 9
- Bollinger Bands (Bollinger Bands). Period 20
- Non-commercial speculative traders, such as individual traders, hedge funds, and large institutions that use the futures market for speculative purposes and meet certain requirements.
- Long non-commercial positions represent the total long open position of non-commercial traders.
- Short non-commercial positions represent the total short open position of non-commercial traders.
- Total non-commercial net position is the difference between short and long positions of non-commercial traders.