
To open long positions on GBP/USD, you need:
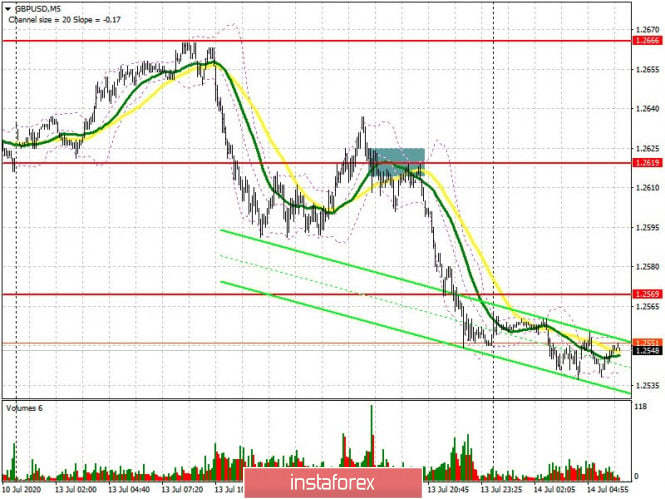
Yesterday, sellers of the pound were happy with a double top forming in the resistance area of 1.2666, where the first sell signal for GBP/USD was also formed, which I spoke about in detail in my forecast for the second half of the day. Also, if you look at the 5-minute chart, you will see how the bears took advantage of the moment and consolidated below the support of 1.2619, forming an additional entry point into short positions from it, which led to updating the low of 1.2569. In the Commitment of Traders (COT) report for July 7, another increase in short and long positions was recorded, which indicates a confrontation between buyers and sellers. However, there were many more bulls than sellers, which led to a decrease in the net position. This does not mean that the market has become bullish, as there is still a fairly high probability of the pound declining further against the background of Brexit uncertainty and other economic problems. The COT report indicates that short non-commercial positions increased from the level of 55,414 to the level of 56,300 during the week. Long non-commercial positions rose from the level of 34,424 to the level of 39,892. As a result, the non-commercial net position decreased its negative value to -16,408, against -20,990, which indicates that the pressure in the market remains after the unsuccessful attempt of the bulls to continue the upward trend. As for the current situation, buyers urgently need to return to the resistance of 1.2564, since only then can we expect a second attempt to grow to the level of 1.2615, where I recommend taking profits. A test of the high of 1.2666 will indicate a new bullish momentum that will be able to update the level of 1.2742. If the pressure on the pound persists in the first half of the day, it is best to count on a false breakout to form in the support area of 1.2511, since only then will it be possible to open long positions. A larger area where you can buy GBP/USD immediately on the rebound will be the low of 1.2448.
To open short positions on GBP/USD, you need:
Sellers of the pound will be waiting for today's reports on UK GDP and industrial production. Poor indicators will only increase the pressure on the pair. Bears need to pay attention to protecting the 1.2564 resistance, since forming a false breakout there will be the first signal to open short positions in continuing the downward trend formed at the beginning of this week. The goal will be to test the support of 1.2511, consolidating under it will only increase the pressure on GBP/USD and pull down the pair to the low of 1.2448, where I recommend taking profits. If there is no activity on the part of sellers at the level of 1.2564 and fundamental data turns out to be good, then the bears' position could weaken. In this case, I advise you to postpone sales until the test of a larger resistance of 1.2615, and also to open short positions immediately for a rebound from the weekly high of 1.2666, counting on a correction of 30-40 points within the day.
Indicator signals:
Moving averages
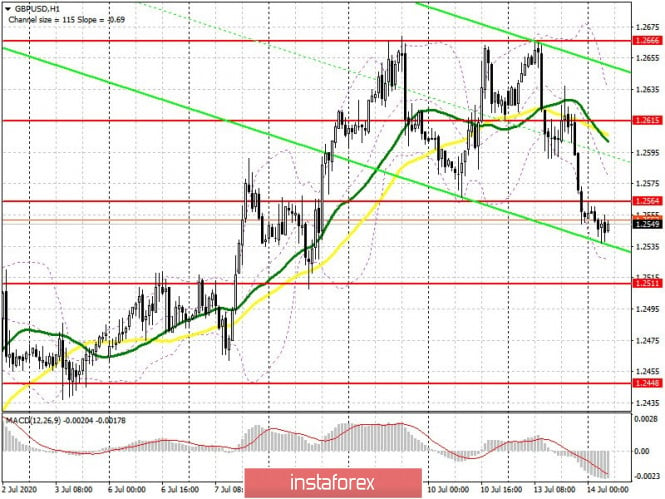
Trading is conducted below 30 and 50 moving averages, which indicates that the market remains under the control of sellers.
Note: the period and prices of moving averages are considered by the author on the hourly chart H1 and differ from the general definition of the classic daily moving averages on the daily chart D1.
Bollinger Bands
A break in the lower border of the indicator at 1.2515 will increase the pressure on the pound. Growth will be limited by the upper level of the indicator in the area of 1.2630.
Description of indicators
- Moving average (moving average, determines the current trend by smoothing out volatility and noise). Period 50. It is marked in yellow on the chart.
- Moving average (moving average, determines the current trend by smoothing out volatility and noise). Period 30. It is marked in green on the chart.
- MACD indicator (Moving Average Convergence/Divergence — convergence/divergence of moving averages) Fast EMA period 12. Slow EMA period to 26. SMA period 9
- Bollinger Bands (Bollinger Bands). Period 20
- Non-commercial traders are speculators, such as individual traders, hedge funds, and large institutions that use the futures market for speculative purposes and meet certain requirements.
- Long non-commercial positions represent the total long open position of non-commercial traders.
- Short non-commercial positions represent the total short open position of non-commercial traders.
- The total non-commercial net position is the difference between short and long positions of non-commercial traders.