
To open long positions on EUR/USD, you need:
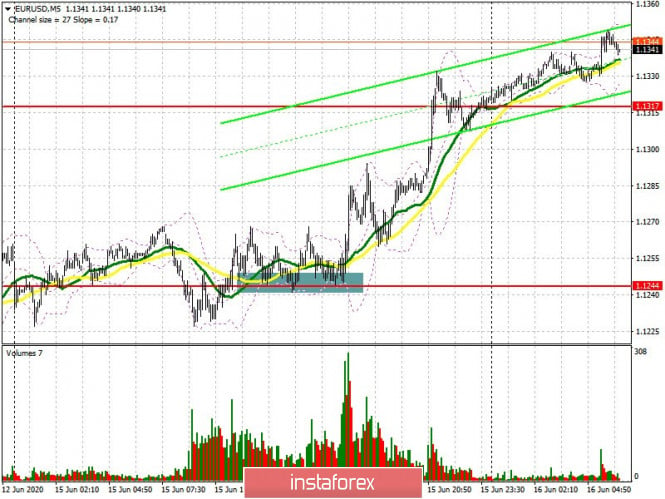
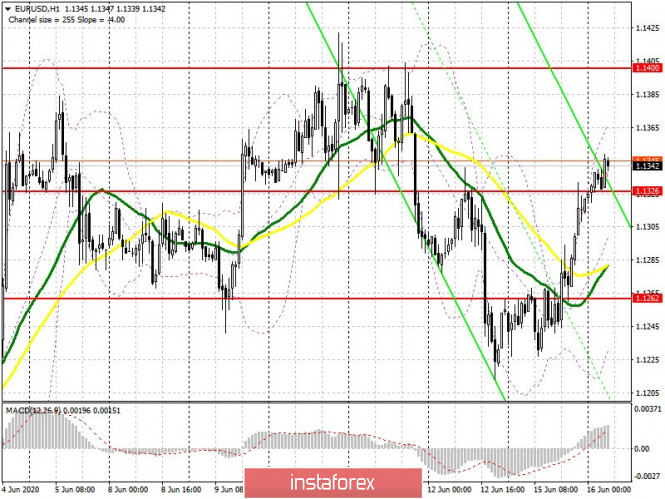
Buyers of the European currency did an excellent job and decided not to wait for the situation to worsen and return to the market as early as possible. In my forecast for the afternoon, I drew attention to purchases above the level of 1.1244 with a repeated test of this range. If you look at the 5-minute chart, you will see how the bears tried to regain the 1.1244 area, each time testing it on the volume, but this only led to forming this range as a new support. The bulls reached resistance 1.1317 by the middle of the US session, where the demand for the euro sharply fell . Not surprisingly, the Commitment of Traders (COT) reports for June 9 recorded an increase in long positions, as well as a reduction in short ones, which indicates that the pair has maintained a bullish momentum at that time even at a weekly closing price of 1.0910, as well as retaining buyer interest with its decline and correction. The report shows a decrease in short non-profit positions from 93,172 to 98,020, while long non-profit positions sharply rose from 174,412 to 184,669. As a result, the positive non-profit net position rose again to 95,639, against 81,240, which indicates an increase in interest in buying risky assets even at current prices high enough for the market. As for the intraday strategy, euro buyers need to keep the market under their control. The first goal is to keep the area 1.1326 and form a false breakout on it, which will be a signal to open long positions in the hope of updating the highs of 1.1400 and 1.1462, where I recommend taking profit. However, the bulls may decide not to be proactive, since we will find a number of important fundamental statistics in the morning: from inflation in Germany to moods in the business environment of the eurozone from the ZEW Institute, which can significantly affect the market. Therefore, if EUR/USD drops below the level of 1.1326, it is best to postpone long positions until an update of support at 1.1262, or buy the euro immediately on the rebound from a new weekly low of 1.1187, counting on a correction of 30-40 points within the day.
To open short positions on EUR/USD, you need:
Sellers urgently need to rehabilitate themselves and as quickly as possible regain the level of 1.1326, on which the further direction of the pair depends. If the eurozone reports turn out to be quite mediocre, the actions of the bears after the breakout and consolidation below the support of 1.1326 will increase the pressure on the pair, which will lead to a return to the support area of 1.1262, where sellers can begin to have difficulties, as moving averages go slightly above this level. It will only be possible to speak with confidence about the resumption of pressure on the euro and the continuation of the downward correction after a real breakout and consolidation below the 1.1262 range, which was formed at the end of last week. Sellers will aim for the low of 1.1187, where I recommend taking profits. If the bulls turn out to be strong in the morning, the euro's growth may lead to updating the high of 1.1400, where I recommend looking at short positions when forming a false breakout. Selling EUR/USD immediately for a rebound is best done from a new weekly high of 1.1462, based on a correction of 30-40 points within the day.
Signals of indicators:
Moving averages
Trading is conducted above 30 and 50 moving averages, which indicates an attempt to return buyers to the euro market.
Note: The period and prices of moving averages are considered by the author on the hourly chart H1 and differs from the general definition of the classic daily moving averages on the daily chart D1.
Bollinger bands
A break of the upper boundary of the indicator in the region of 1.1365 will lead to a new upward momentum of the pair. In case the euro falls, the lower border of the indicator will provide support around 1.1240 from which you can buy for a rebound.
Description of indicators
- Moving average (moving average determines the current trend by smoothing out volatility and noise). Period 50. The graph is marked in yellow.
- Moving average (moving average determines the current trend by smoothing out volatility and noise). Period 30. The graph is marked in green.
- MACD indicator (Moving Average Convergence / Divergence - moving average convergence / divergence) Fast EMA period 12. Slow EMA period 26. SMA period 9
- Bollinger Bands (Bollinger Bands). Period 20
- Non-profit traders are speculators, such as individual traders, hedge funds and large institutions that use the futures market for speculative purposes and meet certain requirements.
- Long nonprofit positions represent the total long open position of nonprofit traders.
- Short nonprofit positions represent the total short open position of nonprofit traders.
- The total non-profit net position is the difference between short and long positions of non-profit traders.