
To open long positions on GBP/USD you need:
Yesterday's speech by Federal Reserve Chairman Jerome Powell resulted in the British pound's fall against the US dollar after a slight upward correction, which could be seen during the release of the report on the rate of decline in UK GDP. If you look at the 5-minute chart, you will see how at the beginning of the US session there was a breakout and consolidation above the 1.2310 level, as well as its test from top to bottom, which was a good signal to open long positions in GBP/USD. However, the Fed chairman's speech crossed out all of the bullish plans, which resulted in a return to 1.2310 and the demolition of stop orders. The only thing you could count on in this situation was to buy immediately on the rebound from a low of 1.2211 (which I indicated in my review), which made it possible to compensate for losses from an unsuccessful transaction in the morning. At the moment, buyers have partially retreated to the 1.2203 level, and forming a false breakout on it in the first half of the day will be a signal to buy the pound against the trend, which will lead to an upward correction and the pair will return to the resistance area of 1.2271, where the bulls will immediately have problems. A further target will be a high of 1.2323, where I recommend taking profit. If the pressure on GBP/USD persists in the morning after the speech of the Governor of the Bank of England Andrew Bailey, it is best to postpone long positions until the test of a low of 1.2170 or even to buy a rebound from a larger support 1.2127 counting on a correction of 30-40 points inside the day.
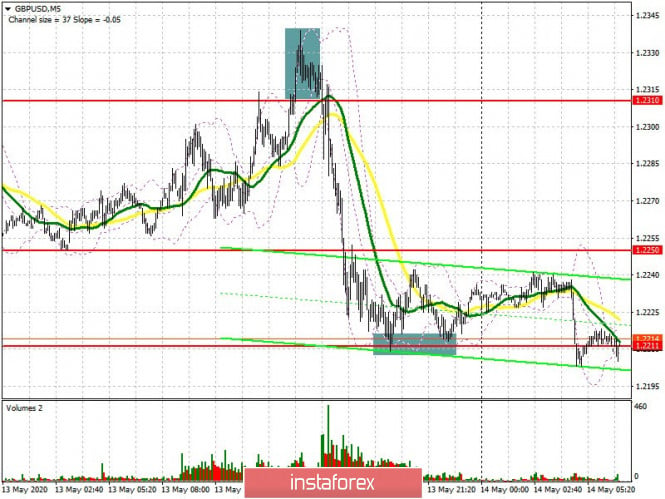
To open short positions on GBP/USD, you need:
Sellers continue to bend their line and pull down the pound. At the moment, their task is to break through and consolidate below 1.2203 support, without which I do not recommend selling the breakout of current lows due to the likelihood of a downward reversal from current lows. The key objectives of the bears at the end of the week will be the levels of 1.2170 and 1.2127, where I recommend taking profits. More acceptable scenarios for opening short positions will be the upward correction of the pound, which can form after the speech of the head of the Bank of England. A false break at 1.2271 will be the first signal to sell the pound. However, it is worthwhile to understand that the downward movement of GBP/USD from this range should be quite fast, since in the absence of activity on the part of large players it is best to postpone short positions and sell the pound immediately for a rebound from a high of 1.2323 per 30-40 correction points within a day.
I recommend that you familiarize yourself with other forecasts:
Trading plan for the European session on the EURUSD pair for May 14
Signals of indicators:
Moving averages
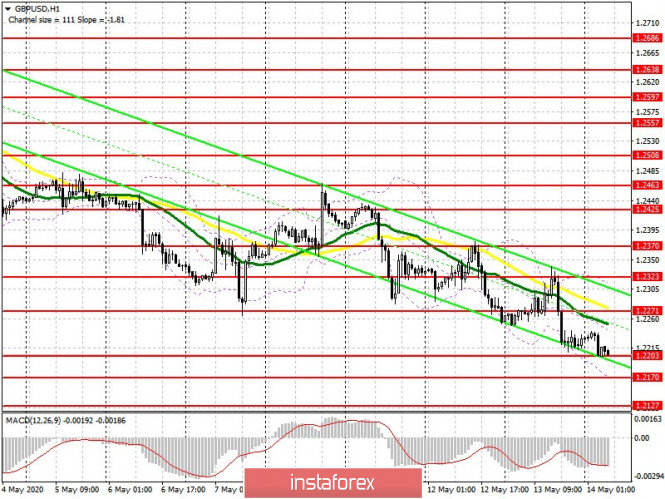
Trading is below 30 and 50 moving averages, which indicates a further decline in the pound trend.
Note: The period and prices of moving averages are considered by the author on the hourly chart H1 and differs from the general definition of the classic daily moving averages on the daily chart D1.
Bollinger bands
Growth will be limited by the upper level of the indicator in the region of 1.2300. Downward movement will be limited by the lower border of the indicator in the area of 1.2170.
Description of indicators
- Moving average (moving average determines the current trend by smoothing out volatility and noise). Period 50. The graph is marked in yellow.
- Moving average (moving average determines the current trend by smoothing out volatility and noise). Period 30. The graph is marked in green.
- MACD indicator (Moving Average Convergence / Divergence - Moving Average Convergence / Divergence). Fast EMA period 12. Slow EMA period 26. SMA period 9.
- Bollinger Bands (Bollinger Bands). Period 20.