
To open long positions on GBPUSD, you need:
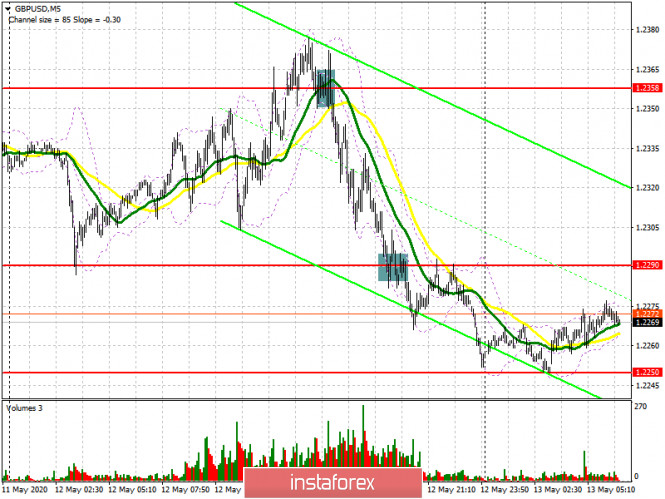
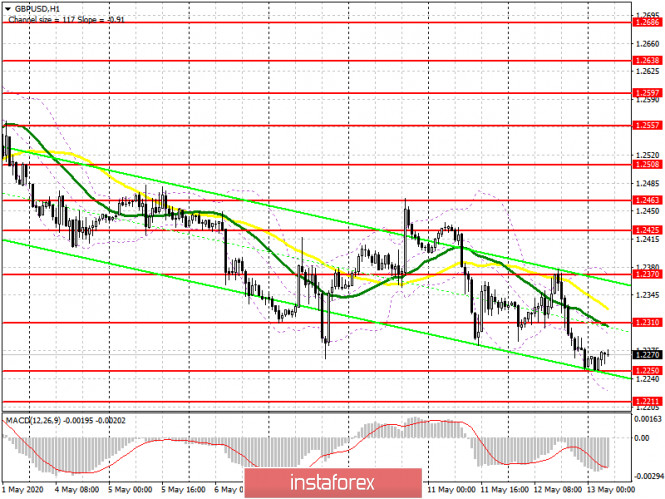
In my review for the second half of the day, I paid attention to sales after the pound returned to the support level of 1.2358, which should have led to a more powerful sale of GBP/USD. If you look at the 5-minute chart, you will see how after fixing above 1.2358 and several unsuccessful attempts to increase the pound in the first half of the day, the bulls left the market, and the bears took control of it, which led to a major sale in the support area of 1.2290. From this level, I recommended buying for a rebound, but there was no serious upward movement from it. The consolidation under this range at the end of the US session only confirmed the full strength of the bearish momentum, which led to a sale in the Asian session to the low of 1.2250, where I also recommended opening long positions. At the moment, the task of buyers is to save this level and only the formation of a false breakout on it in the first half of the day will be a signal to open long positions, which may lead to a small upward correction to the resistance area of 1.2310, where the moving averages are located. The longer-term goal of the bulls remains the test of yesterday's resistance at 1.2370, where I recommend fixing the profits. If the movement will continue to develop along with the trend, and the fundamental data on the UK economy will not please us, it is best to postpone long positions until the update of the lows of 1.2169 and 1.2030, and buy there immediately for a rebound, since it is hardly possible to seriously rely on the support of 1.2211.
To open short positions on GBPUSD, you need:
Sellers will follow the trend, seeking a breakout and consolidation below the support of 1.2250, which will definitely increase pressure on the British pound and lead to a new wave of sales with an exit to the lows of 1.2211 and 1.2169, where I recommend fixing the profits. The longer-term goal of the bulls remains the area of 1.2030. However, a more acceptable scenario for opening short positions will be an upward correction to the resistance area of 1.2310, where the formation of a false breakout, together with a report indicating a serious reduction in UK GDP growth, will be the ideal signal to open short positions. If there is no activity in the resistance area of 1.2310, it is best to postpone short positions for a rebound to the test of the maximum of 1.2370 with the goal of a downward movement of 20-30 points within the day.
Signals of indicators:
Moving averages
Trading is conducted below 30 and 50 moving averages, which indicates a further decline in the pound on the trend.
Note: The period and prices of moving averages are considered by the author on the hourly chart H1 and differ from the general definition of the classic daily moving averages on the daily chart D1.
Bollinger Bands
Growth will be limited by the upper level of the indicator around 1.2370. Breaking the lower border in the area of 1.2211 will lead to a larger sale of the pound.
Description of indicators
- Moving average (moving average determines the current trend by smoothing out volatility and noise). Period 50. The graph is marked in yellow.
- Moving average (moving average determines the current trend by smoothing out volatility and noise). Period 30. The graph is marked in green.
- MACD indicator (Moving Average Convergence / Divergence - moving average convergence / divergence) Fast EMA period 12. Slow EMA period 26. SMA period 9
- Bollinger Bands (Bollinger Bands). Period 20