
To open long positions on GBP/USD, you need:
The British pound made another attempt at growth yesterday as a continuation of Friday's upward correction, but faced problems in the resistance area of 1.2451. The Commitment of Traders (COT) reports for April 21 showed that there are clear changes that indicate the bears return to take control of the market, or at least an attempt to do so. There are fewer people willing to buy the pound, even at current prices. According to the data, during the reporting week, there was an increase in short non-commercial positions from the level of 27,055 to the level of 30,907, while long non-commercial positions decreased from the level of 30,287 to 29,527. As a result, the non-commercial net position turned negative and crossed the zero line, from the level of 3,232 to -1380, which indicates a tipping point and a real resumption of the downward trend for the pound in the short term. As for the intraday situation, the inability of buyers to continue growing above the resistance of 1.2451 yesterday could lead to a larger sell-off of the pound today. The bulls need to keep the pair above the support of 1.2399, and forming a false breakout there will be a signal to open long positions while expecting a repeated return to the resistance of 1.2451. A breakout and consolidation at this level will open a direct path to the highs of 1.2512 and 1.2573, where I recommend taking profits. In case GBP/USD declines in the first half of the day, it is best to look at long positions only after testing the 1.2348 area, or buy immediately for a rebound from the low of 1.2300 in the calculation of a correction of 30-40 points within the day.
To open short positions on GBP/USD, you need:
Sellers have an equally difficult task, they need a breakout to resume the downward trend and then consolidate below the 1.2399 support, on which a lot depends. However, as I noted above, the market is on the side of sellers, so we can expect them to regain control and the pound will decline further. A break of 1.2399 will lead to a rapid decline in the GBP/USD pair to the support area of 1.2348, and sellers will further aim for a low of 1.2300, where I recommend taking profits. Poor data on the state of the US economy, namely the consumer confidence index, will only increase the pressure on the pair. Under the growth scenario in the first half of the day, you can return to short positions on a false breakout from yesterday's resistance of 1.2451, but it is best to sell the pound immediately on a rebound from the high of 1.2512 in the calculation of a correction of 30-40 points within the day.
Signals of indicators:
Moving averages
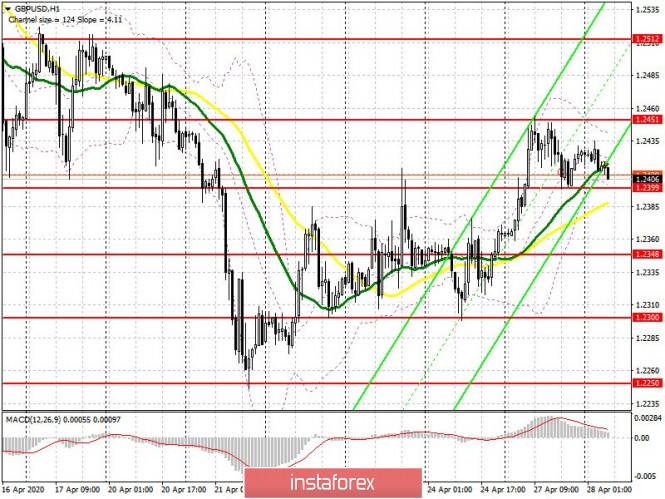
Trade is carried out in the region of 30 and 50 moving average, which indicates an attempt to return control to the bears.
Note: The period and prices of moving averages are considered by the author on the hourly chart H1 and differs from the general definition of the classic daily moving averages on the daily chart D1.
Bollinger bands
A break of the lower border of the indicator in the area of 1.2399 will increase pressure on the pound. Growth above the upper border of the indicator in the area of 1.2440 will lead to a larger upward correction.
Description of indicators
- Moving average (moving average determines the current trend by smoothing out volatility and noise). Period 50. The graph is marked in yellow.
- Moving average (moving average determines the current trend by smoothing out volatility and noise). Period 30. The graph is marked in green.
- MACD indicator (Moving Average Convergence / Divergence - Moving Average Convergence / Divergence). Fast EMA period 12. Slow EMA period 26. SMA period 9.
- Bollinger Bands (Bollinger Bands). Period 20.
- Non-profit traders are speculators, such as individual traders, hedge funds and large institutions that use the futures market for speculative purposes and meet certain requirements.
- Long nonprofit positions represent the total long open position of nonprofit traders.
- Short nonprofit positions represent the total short open position of nonprofit traders.
- The total non-profit net position is the difference between short and long positions of non-profit traders.