
To open long positions on EURUSD, you need:
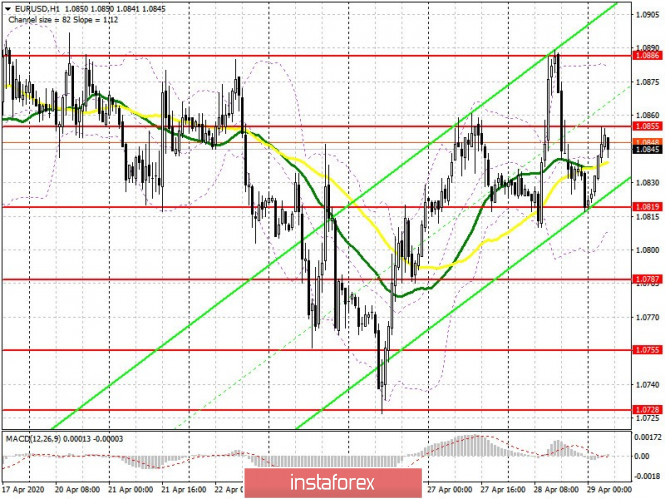
Yesterday's bad data on a sharp drop in the US consumer sentiment index caused the dollar to strengthen against the euro, and the pair returned to the side channel ahead of the upcoming Federal Reserve meeting. At the moment, the bulls are trying to regain the resistance of 1.0855, which will determine the pair's direction. If you manage to gain a foothold above this level in the first half of the day, you can expect a repeated upward correction to a high of 1.0886 and its breakout, with an exit to the resistance of 1.0913, where I recommend taking profit. However, it is not worth counting on a sharp growth without drastic changes in the Fed's policy. In case the euro falls in the first half of the day, the bulls will try to protect the level of 1.0819 and forming a false breakout on it is a signal to open long positions in the pair. Otherwise, I recommend buying EUR/USD only for a rebound from the low of 1.0787, or even lower - from the support of 1.0755 based on a correction of 30-40 points within the day.
To open short positions on EURUSD, you need:
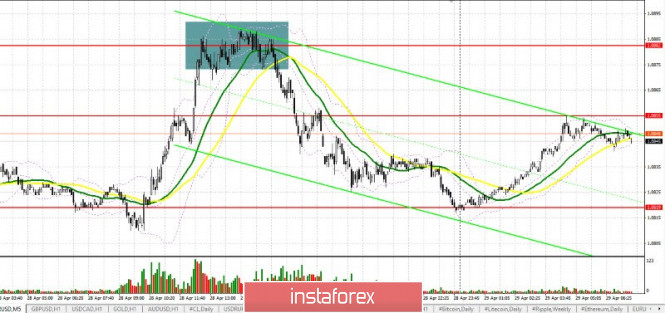
The bears did a great job yesterday by returning to the market after forming a false breakout in the area of 1.0882, which led to a downward correction in the second half of the day. This is clearly visible on the 5-minute chart. In my review, I recommended opening short positions from this level, which brought about 40 points of profit when going down to the nearest goal. At the moment, the sellers' task is to keep the resistance level of 1.0855 and form a false breakout on it, which will be a signal to open short positions while expecting a decline and a breakout of the support of 1.0819. Consolidating below this area, along with poor data on US GDP for the first quarter of this year, will quickly push the pair to the low of 1.0787, and then it will result in an update of the support of 1.0755, where I recommend taking profits. In case EUR/USD grows above the resistance of 1.0855 in the first half of the day, it is best to return to short positions after testing the high of 1.0886, or immediately to rebound from the resistance of 1.0913 based on a correction of 30-40 points within the day.
Signals of indicators:
Moving averages
Trading is conducted slightly above 30 and 50 moving averages, which implies that buyers have a slight advantage.
Note: The period and prices of moving averages are considered by the author on the hourly chart H1 and differs from the general definition of the classic daily moving averages on the daily chart D1.
Bollinger bands
Growth may be limited by the upper level of the indicator at 1.0886. In case the euro falls, it is possible to open long positions for a rebound from the lower border of the indicator in the area of 1.0805.
Description of indicators
- Moving average (moving average determines the current trend by smoothing out volatility and noise). Period 50. The graph is marked in yellow.
- Moving average (moving average determines the current trend by smoothing out volatility and noise). Period 30. The graph is marked in green.
- MACD indicator (Moving Average Convergence / Divergence - moving average convergence / divergence) Fast EMA period 12. Slow EMA period 26. SMA period 9
- Bollinger Bands (Bollinger Bands). Period 20