
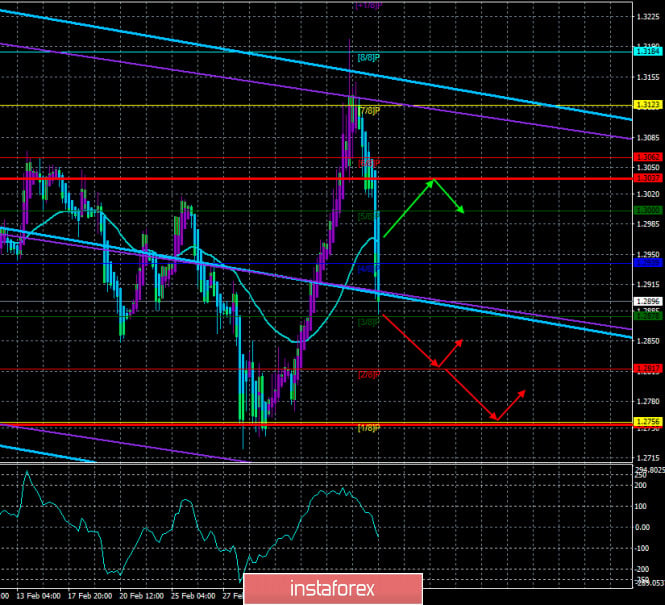
4-hour timeframe
Technical details:
Higher linear regression channel: direction - downward.
Lower linear regression channel: direction - downward.
Moving average (20; smoothed) - downward.
CCI: -42.2616
The British pound, which recently showed some signs of logic in its movements, fell down by 200 points yesterday. On the one hand, this is logical, since we still believe that the panic mood of traders and investors can not be the basis for the growth of a particular currency. Thus, now the pound simply "returns debts" to the US currency. No more. On the other hand, why did the fall start on Tuesday? Why is it so strong? After all, no emergency information was available to traders on this day. Thus, the situation has turned from a classic "swing" into a "roller coaster". The principle is the same, only the movements are stronger. Accordingly, it is extremely difficult to predict anything for the pound/dollar pair at the moment. Tomorrow, the price may turn up again and calmly pass 100-150 points. Macroeconomic statistics, as in the case of the euro currency, are completely ignored, although today, March 11, there will be a lot of important economic information for the GBP/USD pair.
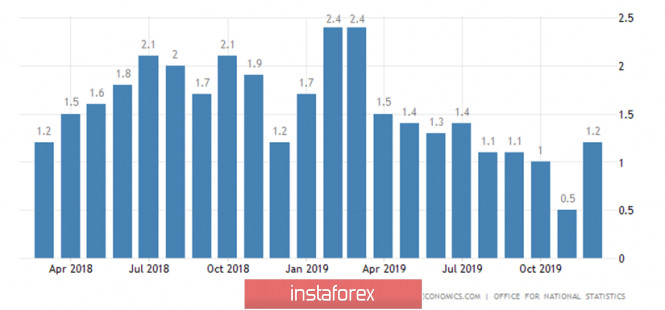
We have already discussed American statistics in the article on EUR/USD. This article focuses on British statistics. First, I would like to note the annual growth rate of GDP, according to the Office for National Statistics. According to the latest data, GDP is 1.2% y/y in December 2019. In January 2020, its growth rate may decrease to 0.8%-0.9% in annual terms and show an increase of no more than 0.2% on a monthly basis.
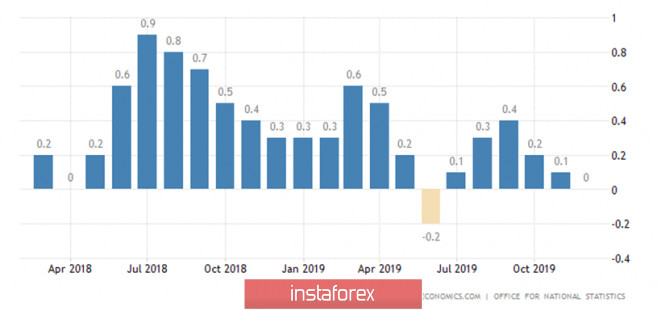
According to the National Institute of Economic and Social Research, the GDP growth rate in February will be only 0.1%, which is even good, compared to zero in January.
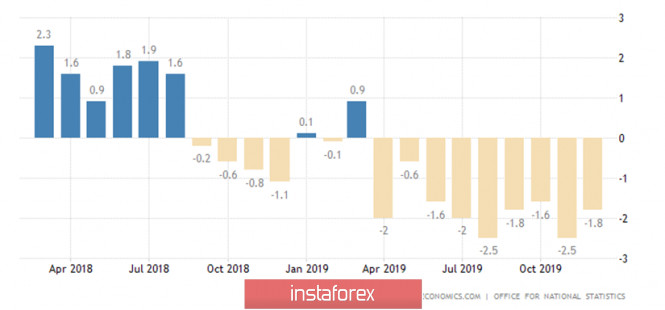
Well, the last and most important report from Albion is industrial production. In December 2019, a decline of 1.8% y/y was recorded, and in January 2020, -2.6 -2.7% y/y is expected. Thus, one of the key indicators of the state of the economy is likely to remain in a deplorable state. Judging by the forecast values, the British currency will not receive any support on March 11. However, as we have already said, it is not a fact that it will need this support, but at least some attention will be paid to the reports. Market participants now most expect decisions from the Bank of England, which must either confirm the universal desire of the world's central banks to hedge against a new crisis or refute it. Perhaps it is the immutability of the key rate in conditions when the Fed immediately reduces it by 0.5% that can become the strongest bullish factor for the British pound. If the British Regulator makes such a decision, we will begin to suspect even more strongly that in the case of the Fed's actions, "everything is not clear". Thus, much will depend on the actions of the ECB and the Bank of England in the near future for the euro and the pound in pairs with the US currency. We believe that the Fed's actions are now aimed not at fighting the "coronavirus", but at reducing the US dollar. At least, there are suspicions. However, in pair with the pound, the US dollar has almost returned to the position of a week ago, before the panic in the markets.
From a technical point of view, the quotes of the pound/dollar pair have fixed back below the moving average line. Thus, the trend has changed again, this time to a downward one. Both linear regression channels continue to be directed downward, which indicates a long-term downward market sentiment. It is very difficult to trade and forecast when the pair regularly changes direction, but there is no clear trend as such. However, these are the realities now for the British pound. Statistics on Wednesday, by the way, will show whether the market has returned to a more or less normal state for itself?
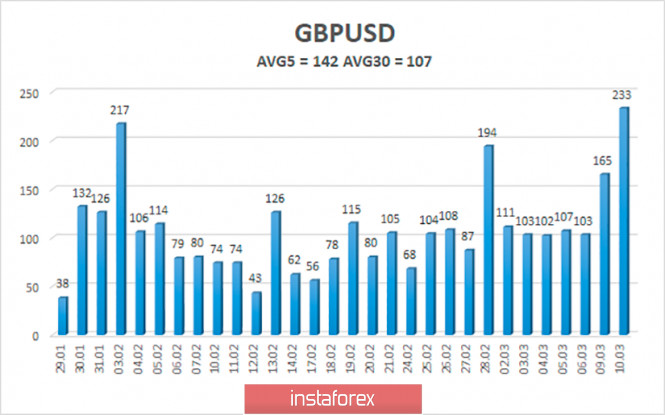
The average volatility of the pound/dollar pair over the past 5 days is 142 points and continues to grow. The last two trading days were all-time highs for the pound. On Wednesday, March 11, we expect the pair to move within the volatility channel of 1.2753-1.3037. The pair is likely to move towards the lower border, but we remind you that fairly strong growth can now begin within the framework of the "swing". Especially if market participants continue to ignore any macroeconomic statistics.
Nearest support levels:
S1 - 1.2878
S2 - 1.2817
S3 - 1.2756
Nearest resistance levels:
R1 - 1.2939
R2 - 1.3000
R3 - 1.3062
Trading recommendations:
The GBP/USD pair abruptly resumed a strong downward movement. Thus, it is now relevant to sell the pound with targets of 1.2817 and 1.2756, before the Heiken Ashi indicator turns up. It is recommended to return to purchases of the British currency with the targets of 1.2817 and 1.2756 if traders break the moving average line again. We remind you that in the current conditions, opening any positions is associated with increased risks.
Explanation of the illustrations:
The highest linear regression channel is the blue unidirectional lines.
The lowest linear regression channel is the purple unidirectional lines.
CCI - blue line in the indicator window.
Moving average (20; smoothed) - blue line on the price chart.
Murray levels - multi-colored horizontal stripes.
Heiken Ashi is an indicator that colors bars in blue or purple.
Possible variants of the price movement:
Red and green arrows.
The material has been provided by InstaForex Company - www.instaforex.com