
USD/JPY
The Japanese yen, as a safe haven currency, but at the same time driven by the stock markets, has recently been in a difficult situation. There are 1277 recorded cases of coronavirus infection (19 dead) in Japan itself. The Japanese Parliament yesterday gave the Prime Minister the power to declare a state of emergency, which includes the cancellation of classes in schools, a ban on mass events, and the creation of operational medical facilities in buildings and on private land without their consent.
The USD/JPY pair rose 300 points yesterday with the close of Monday's gap following the growth of the US stock market (S&P 500 4.94%), but the Japanese market itself is under pressure due to economic recession (GDP shows a decline in the last two quarters). The Nikkei 225 is losing 1.15% today in the Asian session.
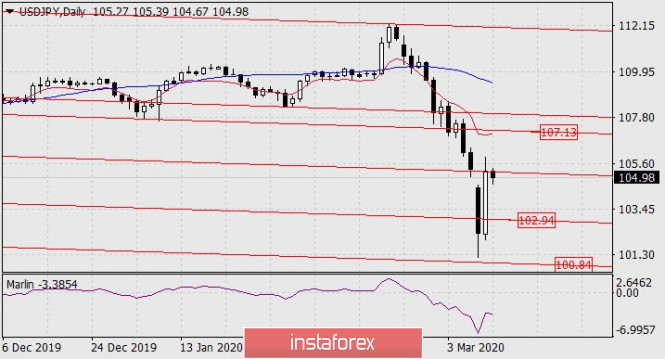
The price is the upper shadow of yesterday's candle above the price channel line on the daily chart. There is a decline in prices from this line this morning. The resumption of growth is now possible after breaking yesterday's high. The goal in this case will be the nearest embedded price channel line in the area of 107.13.
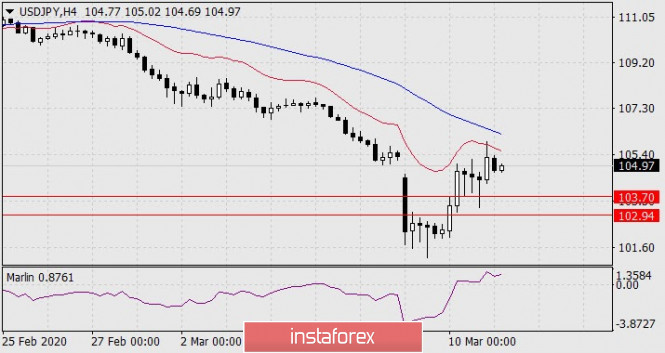
On a four-hour chart, the condition for further decline will be the Marlin line crossing the boundary with the bears' territory. On the price chart, this indicator's transition to the negative area corresponds to the signal level of 103.70. The immediate goal in this scenario is to support the price channel line in the area of 102.94, then support the lower line in the area of 100.84 (daily chart).
The material has been provided by InstaForex Company - www.instaforex.com