
4-hour timeframe
Amplitude of the last 5 days (high-low): 108p - 87p - 194p - 111p - 103p.
Average volatility over the past 5 days: 121p (high).
The British pound has been adjusting quite calmly over the past two days, not reacting in any way to the powerful events taking place in the world. The British currency slightly rose amid the easing of the Fed's monetary policy, did not respond to the comments of Mark Carney, who said that the Bank of England would help British business and the economy cope with the negative impact of coronavirus. The head of the British central bank, who will resign after 10, said that if the situation worsens and the economic shock does not pass, the BoE is ready to take all necessary measures to stabilize the economic situation. It is obvious to all traders that we are talking about lowering the key rate. The Fed and the Reserve Bank of Australia have already lowered their key rates; now the British and European regulators are in line. But we are more interested in the GBP/USD pair rate, as well as the reaction of most traders to what is happening in the world. But there is practically no reaction now. One has only to look at the movement of the EUR/USD pair and compare it with the movement of the pound/dollar. It immediately becomes clear that the British currency is now in hibernation. However, perhaps this is even better than if the same unreasonable and non-predictable movements as the EUR/USD would now flow along the pound/dollar pair.
Despite the fact that most traders of the pair keep calm and cool, events concerning the UK and the pound are now abound. We've already talked about Mark Carney's speech. In fact, now you only need to wait for the next meeting of the British regulator to find out about the rate cut. Traders did not react to the Fed rate cut. At the same time, the first stage of negotiations between Britain and the EU concerning the further coexistence of the bloc and the UK after 2020 is taking place. So far, no specific information has been received in the media, but we still believe that it will be very difficult for traders to wait for optimistic data. Although you should not jump to conclusions. You should simply monitor the nature of the information received. And it can start arriving tomorrow, when the first stage of negotiations is completed.
By the way, we somehow too quickly concluded that the euro/dollar currency pair is being traded very strangely, but the pound/dollar is much more logical. Today's macroeconomic statistics from overseas were completely ignored by market participants. Let's start, however, with British statistics. The index of business activity in the construction sector was 53.2 in February, only slightly lower than in January (53.3). Thus, such a weak change in the value of the indicator could not cause a serious market reaction. The data from the United States were required to favorably influence the position of the US currency. ADP's report on changes in the number of employees in the private sector exceeded experts' forecasts and amounted to 183,000. Recall that it is very important for the US government that the country maintains low unemployment and a strong labor market. Therefore, any positive data on the labor market almost always causes the dollar to strengthen. But not today. The ISM index of business activity in the service sector could also provide significant support to the greenback, which rose to 57.3 compared to the previous month (55.5). Interestingly, the same Markit index remained unchanged at 49.4. That is, two indexes that show the state of the same sphere indicate completely different things. Nevertheless, the ISM index is considered more important, so we had the right to expect the dollar to grow. But it did not happen after the publication of this indicator. Andrew Bailey, who will succeed Mark Carney from March 16, 2020, is also scheduled to speak today. Perhaps the future head of the Bank of England will tell the markets something interesting. However, we still tend to believe that traders are lying low and waiting. Perhaps they are waiting for data from trade negotiations. Perhaps they are waiting for positive news about the fight against the coronavirus. Perhaps they are waiting for the tension to subside from the stock and currency markets.
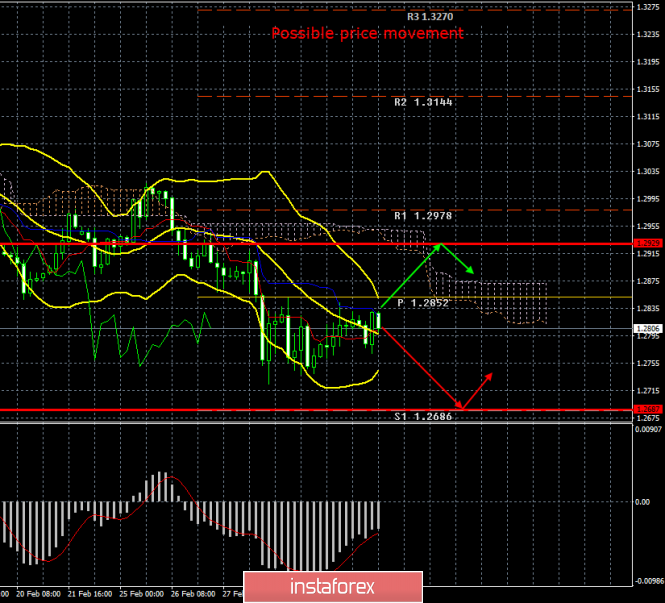
An upward correction continues from a technical point of view, and the price has already worked out the Kijun-sen line. Thus, a rebound from this line can trigger a resumption of the downward movement. However, despite the fact that, from our point of view, the general fundamental background remains in favor of the dollar, now is such a time that it is extremely difficult to predict the movement of any pair. Ichimoku and Bollinger Bands show a downward trend.
Trading recommendations:
The GBP/USD pair continues the upward correction. Thus, it will be possible to sell the British pound again with the target of the support level of 1.2686, after the completion of the current correction (MACD indicator turns down or rebounds from the Kijun-sen line). We recommend considering the pair's purchases with targets at the level of 1.2929 and the Senkou Span B line in small lots if the bulls are able to gain a foothold above the Kijun-sen line. The macroeconomic background now has practically no effect on the movement of the pair.
Explanation of the illustration:
Ichimoku indicator:
Tenkan-sen is the red line.
Kijun-sen is the blue line.
Senkou Span A - light brown dotted line.
Senkou Span B - light purple dashed line.
Chikou Span - green line.
Bollinger Bands Indicator:
3 yellow lines.
MACD indicator:
Red line and bar graph with white bars in the indicators window.
Support / Resistance Classic Levels:
Red and gray dashed lines with price symbols.
Pivot Level:
Yellow solid line.
Volatility Support / Resistance Levels:
Gray dotted lines without price designations.
Possible price movements:
Red and green arrows.
The material has been provided by InstaForex Company - www.instaforex.com