4-hour timeframe

Technical data:
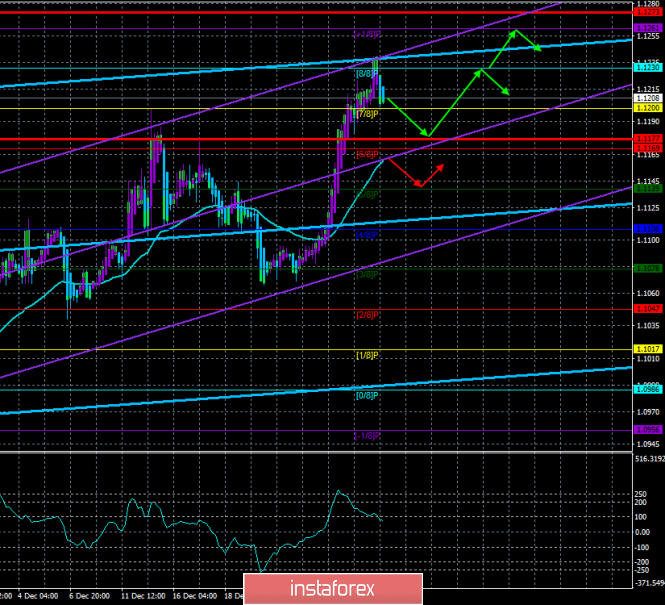
The upper channel of linear regression: direction - up.
The lower channel of linear regression: direction - up.
The moving average (20; smoothed) - up.
CCI: 72.8130
Well, the holidays are over. Ahead is still the celebration of the Nativity of Christ according to the Christian calendar, however, this holiday will have a very indirect relation to the forex market. Thus, it is quite possible to assume that the days with unreasonable movements are over for the currency market. At least, I hope so. At the end of 2019, the European currency managed to rise in price against the US dollar by 130 points. It doesn't seem like much, but it's still growth. If we take into account the fact that for the whole of 2019, the euro currency fell against the dollar by 2.5 cents, then 130 points are not so small. And most importantly, of course, there were no fundamental reasons for such growth. In the last days of 2019, no important macroeconomic information was published in the United States or the European Union, there were no important data from top officials of the ECB, the European Parliament, the Fed, or Donald Trump. Thus, we associate this strengthening of the euro currency with purely psychological factors. For example, with the desire of traders before the New Year to close some of the "dollar" positions, which led to a drop in demand for the dollar and its cheapening. Or a major player entered the market in the last days of the outgoing year, which also got rid of the US currency. One way or another, we do not consider the strengthening of the euro currency justified. As a result, we believe that the euro will fall again paired with the US currency, and this movement will begin soon. First, you need to work out the 130 points that were won on the "New Year" week. Next, we are waiting for the formation of a new downward trend. Of course, as before, we do not recommend to work "ahead of the curve" and try to guess the endpoint of the upward trend. It is better to wait for the technical indicators to turn down and then start trading lower.
The first day of the new year will not give traders time to swing. Today, in the European Union and America, indices of business activity in the sphere of production for December will be published. In recent months, this indicator is one of the most important for both European countries and the United States. After all, a business activity now has a pronounced tendency to decline and pulls down a lot of other macroeconomic indicators. According to experts' forecasts, business activity in the locomotive country of the entire EU economy (Germany) will remain at an extremely low level - 43.4. In other countries, the situation is no better. In Spain, the expected value is 47.0, in Italy - 47.2, in the UK - 47.6, in the EU as a whole - 45.9. Even if the real values are slightly higher than the forecasts, all business activity indices will remain in the "recession zone". Thus, I would not expect any improvement in the production sector of the EU countries today. Only in France, the manufacturing sector is still afloat with a previous reading of 50.3 and a similar forecast for December. What does it mean? This means that in the next month, the state of the EU economy should not be expected to improve. Industrial production may again decline against the background of such business activity, respectively, will be inclined to decline and GDP.
In the United States, at first glance, the situation is a little better. At least the Markit PMI is forecast at 52.5, however, we remind you that the more important index is the ISM, which will be published on Friday and currently stands at 48.1. Thus, US business activity indices contradict each other. One indicates a decline in production, the other - a strong growth. But since the ISM is more important, tomorrow buyers of the US dollar may be disappointed.
In general, we believe that after the "euro-week" the currency pair now has only one road - down, and, despite the fundamental background. The euro has risen unreasonably, now you have to pay off debts. From a technical point of view, the correction has already started, as indicated by the indicator Heiken Ashi, the nearest correction targets are 1.1177 and the moving average line. Further, for our hypothesis to be confirmed, traders will need to overcome the moving average.

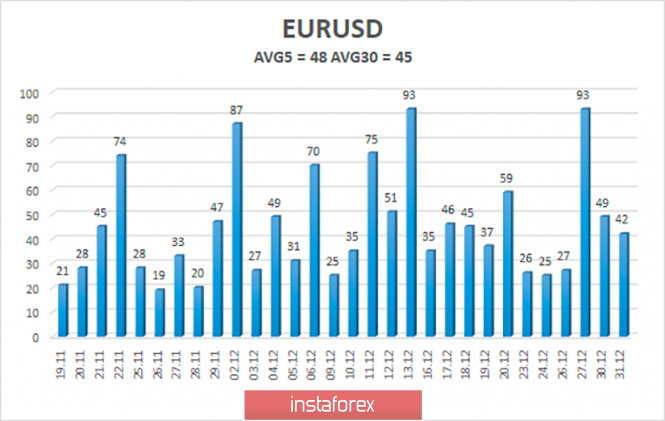
The average volatility of the euro-dollar currency pair is now 48 points, which is the average value for the euro currency. Thus, we have volatility levels on January 2 - 1.1177 and 1.1273. Thus, today we expect to work out the lower limit of the volatility channel.
Nearest support levels:
S1 - 1.1200
S2 - 1.1169
S3 - 1.1139
Nearest resistance levels:
R1 - 1.1230
R2 - 1.1261
R3 - 1.1292
Trading recommendations:
The euro-dollar pair started a downward correction. Formally, buy orders with the goals of 1.1230 and 1.1261 are still valid, but their opening can be considered no earlier than the completion of the current correction. The general fundamental background remains not on the side of the euro currency, so the pair's fall is more preferable. It is recommended to return to sales of the euro-dollar pair not before fixing below the moving average line.
In addition to the technical picture, you should also take into account the fundamental data and the time of their release.
Explanation of the illustrations:
The upper channel of linear regression - the blue line of the unidirectional movement.
The lower channel of linear regression - the purple line of the unidirectional movement.
CCI - the blue line in the indicator window.
The moving average (20; smoothed) - the blue line on the price chart.
Murray levels - multi-colored horizontal stripes.
Heiken Ashi - an indicator that colors bars in blue or purple.
Possible variants of the price movement:
Red and green arrows.
The material has been provided by InstaForex Company - www.instaforex.com