
Trend analysis (Fig. 1).
On Tuesday, the price may continue to move up with the first target 1.2976, the resistance line of the side channel presented in a red bold line. In case of breaking through this level, the continuation of the upward movement to the upper fractal is 1.3013 presented in a blue dashed line.
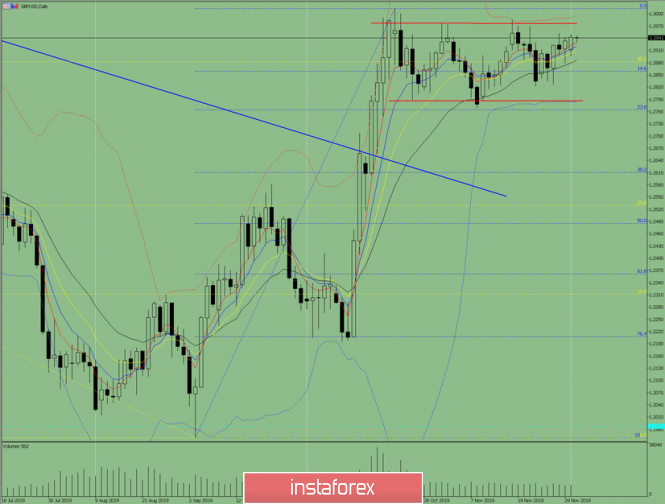
Fig. 1 (daily chart).
Comprehensive analysis:
- Indicator analysis - up;
- Fibonacci levels - up;
- Volumes - up;
- Candlestick analysis - up;
- Trend analysis - up;
- Bollinger Lines - up;
- Weekly schedule - up.
General conclusion:
On Tuesday, the price may continue to move up with the first target 1.2976, the resistance line of the side channel in a red bold line. In case of breaking through this level, the continuation of the upward movement to the upper fractal is 1.3013, presented in a blue dashed line.
Possible scenario: from the level of 1.2976, work down with the first target of 1.2823 that is the lower fractal.
The material has been provided by InstaForex Company - www.instaforex.com