
EUR/USD
Analysis:
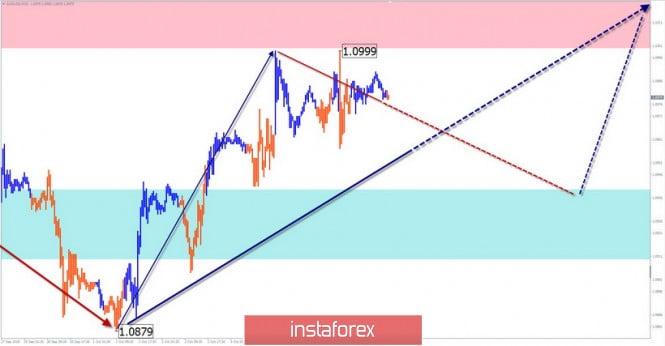
On the euro chart, two upward models of different scales are formed right away and both have the wrong kind of structure. The bullish zigzag of September 3 is at the end of a larger wave of August 1. In the small model, the final part (C) reached intermediate resistance.
Forecast:
Before a further price breakthrough, a correctional phase is likely. Today, a "sideways" is expected between the nearest oncoming zones. At the next session, a short-term decline of the pair is possible.
Potential reversal zones
Resistance:
- 1.1000 / 1.1030
Support:
- 1.0940 / 1.0910
Recommendations:
Today, the most promising tactics of trade will be the purchase of the euro in the lower boundary of the price range. Selling a pair makes sense only within the trading session, tracking all the oncoming signals.
AUD/USD
Analysis:
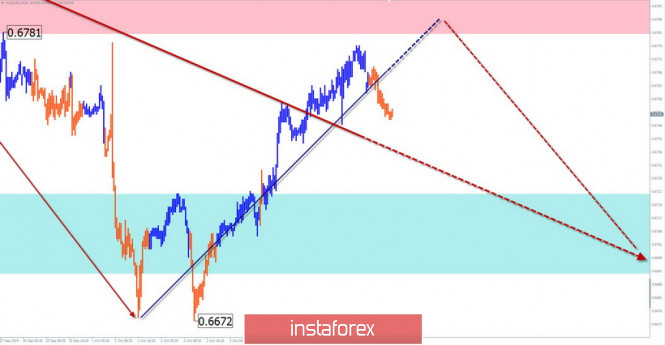
The AUD chart is dominated by a bearish trend. Its last direction started on September 12. In its framework, a hidden correction has been formed since the end of September. The structure looks complete. The final section (C) reached the lower boundary of the calculation zone. There are no reversal signals on the chart.
Forecast:
There is a high probability of completion of the current correction in the framework of the calculated resistance. Today, a second attempt to pressure this zone is expected. By the end of the day, the chance of a reversal and the beginning of a decline increases.
Potential reversal zones
Resistance:
- 0.6780 / 0.6810
Support:
- 0.6720 / 0.6690
Recommendations:
When buying a pair today, the limited upside potential should be taken into account. In the resistance area, it is recommended to focus on the search for pivot signals and points of sale of the instrument.
GBP/JPY
Analysis:
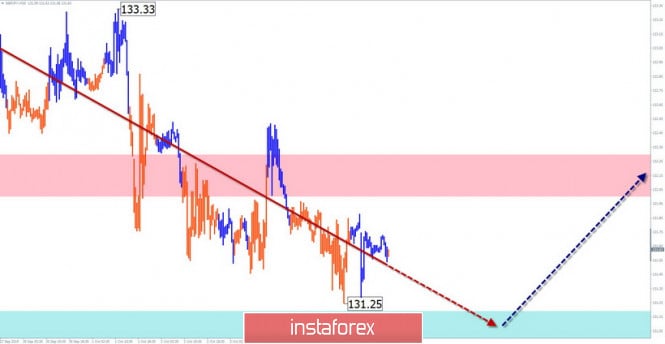
On the cross-instrument chart, the price has been decreasing over the past month, forming a correction of the previous bullish section. Its internal structure looks complete. The price is approaching the upper zone of a wide zone of potential reversal of a large TF. There are no signals of course change.
Forecast:
In the coming sessions, a general flat mood is expected. In the morning, the price will continue to decline. By the end of the day, the probability of a reversal and the beginning of a price increase increases.
Potential reversal zones
Resistance:
- 132.00 / 132.30
Support:
- 131.20 / 130.90
Recommendations:
Prior to the appearance of clear reversal signals, cross-instrument sales are a priority. Due to the small size of the expected downward movement, the lot should be reduced. In the area of the support zone, it is recommended to monitor pivot signals to search for entry points to a long position.
Explanations: In a simplified wave analysis (UVA), the waves are composed of 3 parts (A-B-C). The last unfinished wave is analyzed, while the solid background of the arrows shows the formed structure, dotted - the expected movement.
Attention: The wave algorithm does not take into account the length of time the instrument moves in time!
The material has been provided by InstaForex Company - www.instaforex.com