
Gold price continues to move sideways without any clear short-term direction. Price has formed a triangle pattern and soon we should expect volatility to rise, as price is running out of space. The triangle has $1,493 as the upper boundary and $1,481 as the lower boundary.
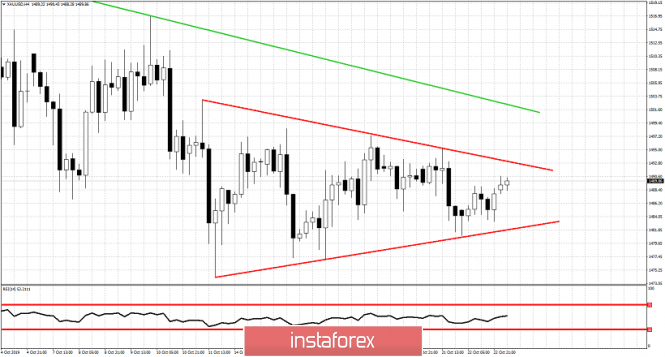
Red lines - triangle pattern
Gold price is trapped inside the narrowing trading range we see in the 4 hour chart above. Price will soon break the triangle pattern and traders better not bet against it. If price breaks above $1,493 and manages to recapture $1,500 and stay above it, we should expect a new bullish wave to start that will eventually challenge $1,525-35 major resistance. If the triangle is broken downwards we expect price to move towards $1,460-40 area.
The material has been provided by InstaForex Company - www.instaforex.com