
EUR/USD
The euro fell by 24 points by the end of Tuesday, reaching Friday lows, but trading volumes were average, that is, there was no major closing of positions, and this, as we said in the previous review, will be the main criterion for the exchange rate reversal in the current speculative situation. But such large closures occurred on related currencies: the British pound, the Canadian dollar, the Australian dollar, at least the Swiss franc. It is likely that with further events contributing to this closure, major closures will occur for the euro. Apparently, investors are waiting for ECB decisions on Thursday, but in general no changes in monetary policy are expected, since this is the last meeting for Mario Draghi as the chairman of the ECB, and everything he wanted was already done at the previous meeting. Next, the reins will go to Christine Lagarde.
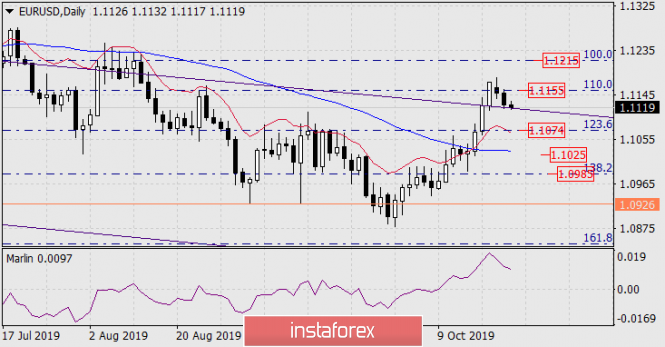
So, we are waiting for the massive closure of positions tomorrow, but the current technical situation does not have a clear decline in the euro. On the daily chart, the price is trying to overcome the support of the price channel line. But even if the price drops to 1.1074, in case of political surprises, a reverse exit is possible over this trend line on the technical justification of price development in an upward trend - above the MACD line.
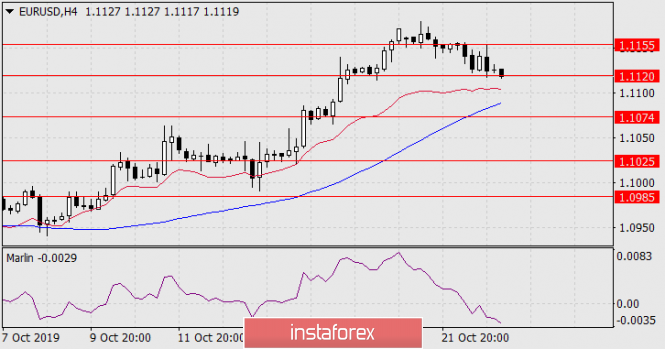
On the four-hour chart, the first sign of a breakthrough of support is when the Marlin oscillator departs into the lower zone. As in the higher chart, the price is developing above the indicator lines of balance and MACD. When the price reaches the Fibonacci level of 123.6% (1.1074), it will automatically be below the MACD line at H4, which will amplify the signal.
The material has been provided by InstaForex Company - www.instaforex.com