Crypto Industry News:
Bitcoin's energy consumption is becoming more and more efficient despite the fact that the hashrate indicator is still reaching record levels, as new data suggests.
Data from the Statista aggregator showed that, despite the greater computing power for Bitcoin mining, less electricity is needed to power this process. According to one chart, energy consumption in July was 69.79 terawatt hours per year. In July 2018, the figure was 71.12 terawatts, and the hashrate rate was almost 60% lower than today.
Hash rate measures the overall computing power associated with processing Bitcoin transactions. In August, the indicator went through 80 hash / s quintillion, and is now almost 90 quintillion. In July 2018, this figure was about 40 quintillion.
Therefore, the data are part of the general tendency to increasing ecological awareness among miners. When Bitcoin prices increased this year, many operators announced attempts to improve performance.
A June study found that three-quarters of Bitcoin mining operations are powered by renewable energy sources. Equipment manufacturers have sought to develop new devices with greater capabilities and lower energy requirements, such as Bitmain's 7-nm Antminer, which debuted in November last year.
Technical Market Overview:
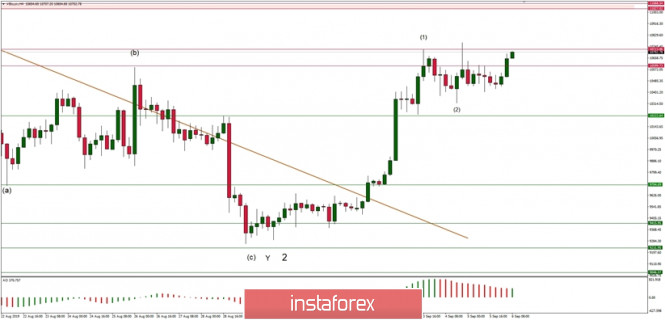
The BTC/USD pair has made a new marginal local high at the level of $10,775 after the technical resistance at the level of $10,222 has been violated. The market is still developing the local pull-back in the wave (2) and when finished a new higher high should be made with a target at the level of $11,068. The move-up is the biggest in terms of range so far, so it is quite possible that this is the wave (1) of the overall impulsive cycle up. Moreover, it means, the corrective cycle in wave 2 had been completed at the level of $9,231 and now the market resumes the uptrend. This scenario is valid as long as the level of $9,231 is not clearly violated.
Weekly Pivot Points:
WR3 - $11,528
WR2 - $11,079
WR1 - $10,223
Weekly Pivot Point - $9,753
WS1 - $8,875
WS2 - $8,358
WS3 - $7,589
Trading Recommendations:
The best strategy in the current market conditions is to trade with the larger timeframe trend, which is still up. All the shorter timeframe moves are being treated as a correction inside of the uptrend. The larger degree WXY correction might have been completed and the market might be ready for another impulsive wave up of a higher degree. Any violation of the level of $9,231 invalidates the bullish impulsive scenario.